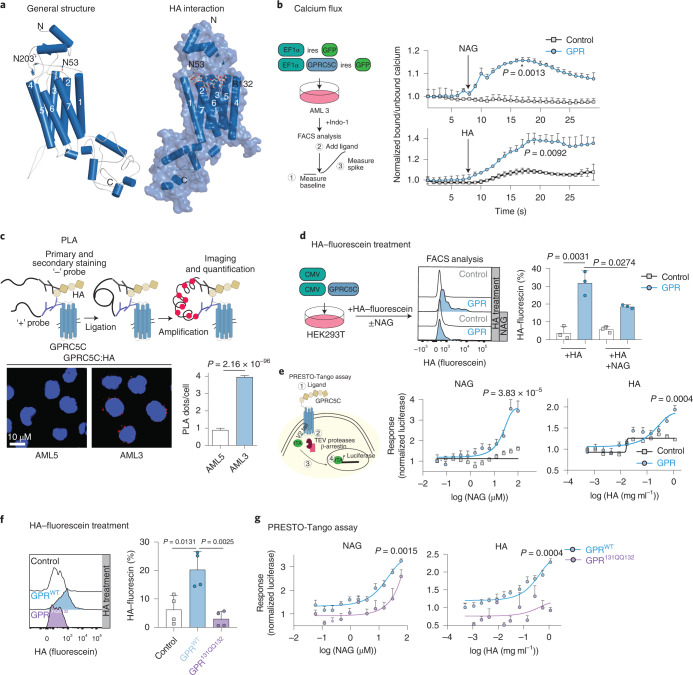
Fig. 5. HA activates GPRC5C signalling.
a, Left: structural modelling of GPRC5C. Right: docked pose of the HA at the 7TM region of GPRC5C. b, Experimental design to determine intracellular calcium concentrations upon interaction with putative ligands. Normalized baseline calcium followed by flux in response to HA or NAG in control and GPRC5C-OE conditions in AML3. n = 3 experiments. c, PLA between GPRC5C and HA, showing a distance smaller than 80 nm in AML3 cells but not AML5 cells. Plot representative of one of three independent experiments. Each independent experiment was performed in two technical replicates. n = 2250 cells for AML5 and n = 2091 cells for AML3. Presented as mean ± s.e.m. d, HA–fluorescein treatment of HEK293T cells expressing GPRC5C and control. FACS plot representing HA retention in each condition. n = 3 experiments. e, Left: schematic representation of PRESTO-Tango assay. Right: concentration–response curve of PRESTO-Tango construct for GPRC5C and control vector treated with NAG and HA in HTLA cells. Normalized to luciferase signal at the lowest concentration. n = 6 experiments for NAG and n = 5 experiments for HA. f. HA–fluorescein treatment of HEK293T cells expressing GPRC5CWT, GPRC5C131QQ132 and control. FACS plot representing HA retention in each condition. n = 4 experiments. g, Concentration–response curve of PRESTO-Tango construct for GPRC5C WT and site-specific mutant (GPRC5C131QQ132) at predicted HA interaction site in HTLA cells. n = 6 experiments. All data presented as mean ± s.d. unless otherwise stated. Statistical significance was determined using unpaired two-tailed t-test (b, c, d, e, f and g). n indicates number of replicates. For all experiments, at least two independent experiments were performed. Source numerical data are available in source data.

