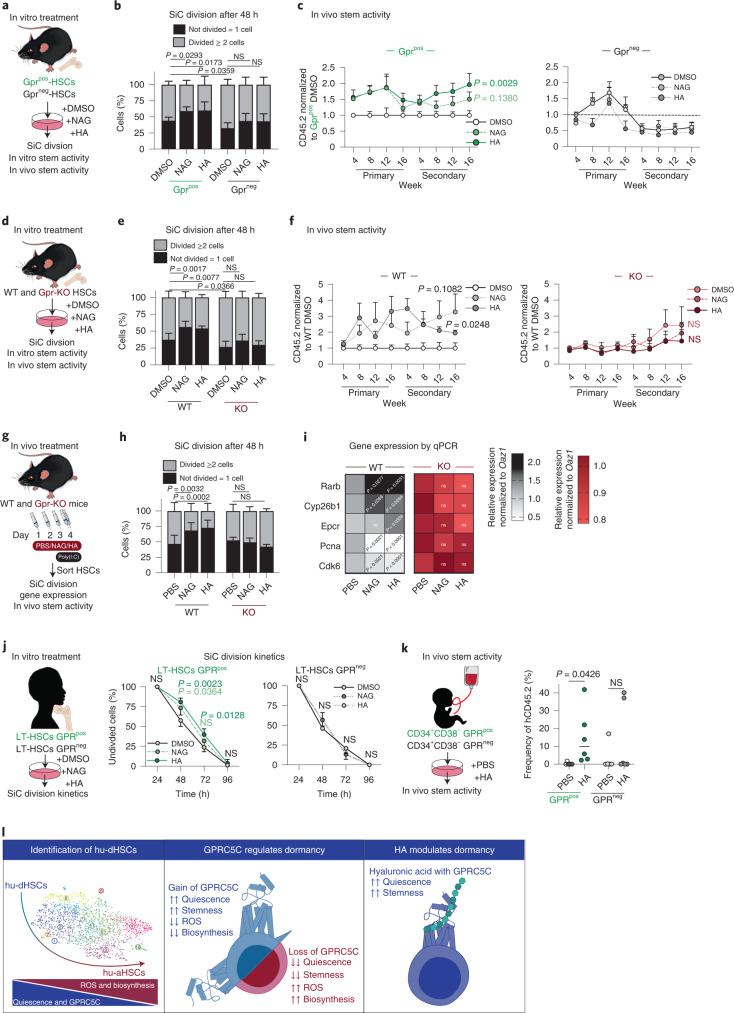
Fig. 6. HA–Gprc5c signalling axis regulates human and mouse HSCs.
a, Experimental design to assess the effect of in vitro HA and NAG treatment on Gprc5cpos/neg–HSCs. b, SiC division assay of Gprc5cpos/neg–HSCs quantified after 48 h in vitro culture treatment with NAG, HA and DMSO control. n = 8 biological replicates. c, Transplantation of Gprc5cpos/neg–HSCs treated with NAG, HA and DMSO control. n = 7 biological replicates, except n = 5 biological replicates for Gprc5cpos-HSCs treated with NAG. d, Experimental design to assess the effect of in vitro HA and NAG treatment on Gprc5c-KO and WT control HSCs. e, SiC division assay of Gprc5c-KO and WT control HSCs quantified after 48 h in vitro culture treatment with NAG, HA and DMSO control. n = 6 biological replicates. f, Transplantation of Gprc5c-KO and WT control HSCs treated with NAG, HA and DMSO control. n = 9, 9, 6, 11, 12 and 17 biological replicates for WT-DMSO, WT-NAG, WT-HA, Gpr-KO-DMSO, Gpr-KO-NAG and Gpr-KO-HA, respectively. g, Experimental design to assess the effect of in vivo NAG and HA treatment in preventing viral stress from poly I:C. HSCs defined as Lineage−cKit+Epcr+CD150+CD48−CD34−. h, SiC division assay of in vivo treated Gprc5c-KO and WT control HSCs cells quantified after 48 h of in vitro culture. n = 6 biological replicates. i, Differential gene expression. Heat map representing median RNA expression from qPCR data (normalized to housekeeping gene Oaz1 and PBS control) n = 11 biological replicates. j, SiC division kinetics of BM GPRC5Cpos/neg–LT-HSCs with in vitro culture treatment with NAG, HA and DMSO control. n = 4 biological replicates. k, Transplantation of GPRC5Cpos/neg-HSCs from two CB donors treated with HA and control. n = 6 biological replicates. l, Representative summary of findings. All data presented as mean ± s.d., except i where median is presented. Statistical significance was determined using two-tailed t-test (c, f, i and k) or two-way ANOVA (b, e, h and j). n indicates number of biological replicates. For all experiments, at least two independent experiments were performed. Source numerical data are available in source data.

