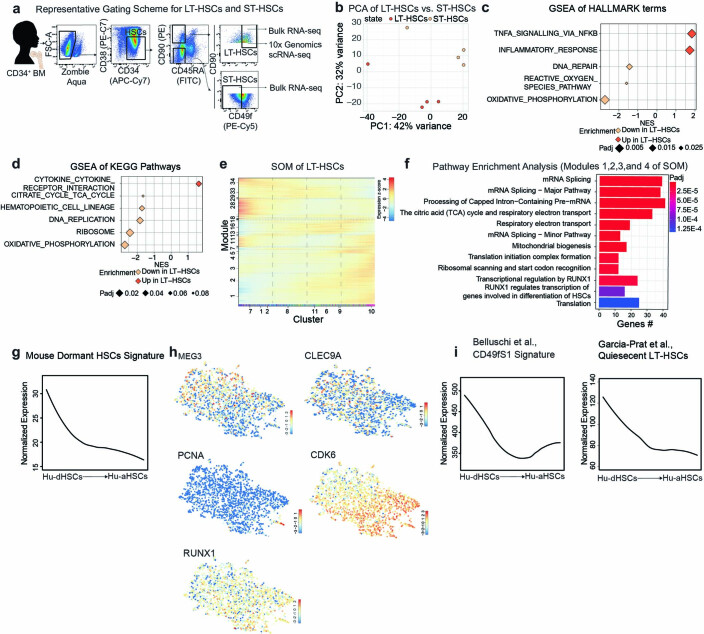
Extended Data Fig. 1.
a. Representative FACS gating for HSCs (CD34+CD38−), ST-HSCs (CD34+CD38−CD90−CD45RA−CD49f−), and LT-HSCs (CD34+CD38−CD45RA−CD90+CD49f+) from CD34+ BM donors used for bulk RNA-seq and scRNA-seq. b. Principal component analysis (PCA) of RNA-seq data from LT-HSCs and ST-HSCs. Based on top 5,000 variable genes after variance-stabilization of DESeq2 Wald test. c. GSEA of Hallmark terms in LT-HSCs compared to ST-HSCs. d. GSEA of KEGG Pathways in LT-HSCs compared to ST-HSCs. e. SOM of LT-HSCs from scRNA-seq. f. Pathway enrichment analysis from modules 1, 2, 3, and 4 of SOM of LT-HSCs. Hypergeometric test. g. Smoothed pseudo-temporal normalized expression profile of Mouse dormant HSCs signature in LT-HSCs. Smoothed profiles were computed by local regression. h. LT-HSC expression UMAPs of the stem and activation associated genes. The colour bars indicate log2-normalized expression. i. Smoothed pseudo-temporal normalized expression profile of the Cd49f1 signature from Bellushi et al., and Quiescent LT-HSCs from García-Prat et al., smoothed profiles were computed by local regression. Colour bars at the bottom of the SOMs show VarID clusters or RaceID clusters. The y-axis of the smoothed pseudo-temporal expression profiles indicates normalized expression. GSEA was performed with BH-adjusted p-values after adaptive multilevel splitting Monte Carlo approach.

