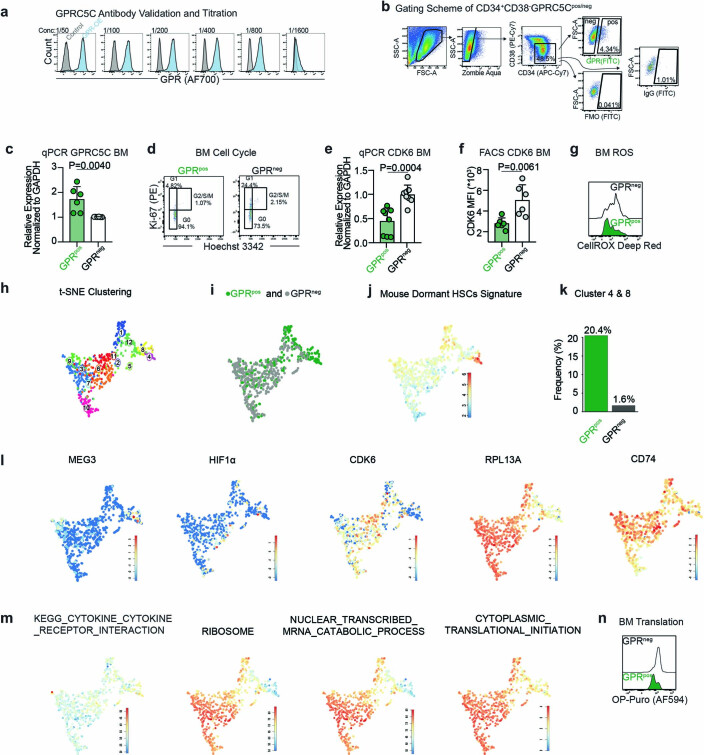
Extended Data Fig. 2.
a. Titration of monoclonal human GPRC5C antibody. HEK293T transfected with overexpressing GPRC5C or control plasmid and stained with decreasing concentration (left to right) of the GPRC5C antibody. b. Representative FACS scheme for gating of GPRC5Cpos/neg-HSCs. GPRC5Cpos cells are identified using a fluorescence minus one (FMO) or IgG control. c. qPCR validation of GPRC5C RNA expression from BM GPRC5Cpos/neg-HSCs. Normalized to housekeeping gene GAPDH and GPRC5Cneg. n = 6 biological replicates. d. Representative FACS plots of cell cycle profiles from BM GPRC5Cpos/neg-HSCs. e. qPCR of CDK6 expression from GPRC5Cpos/neg-HSCs. Normalized to GAPDH gene and then GPRC5Cneg-HSCs. n = 8 biological replicates. f. FACS measurement of CDK6 MFI in BM GPRC5Cpos/neg-HSCs. n = 6 biological replicates. g. Representative FACS histogram of CellROX Deep Red MFI in BM GPRC5Cpos/neg-HSCs. h. t-SNE representation of the clusters from BM GPRC5Cpos/neg-HSCs. i. t-SNE depicting BM GPRC5Cpos/neg-HSCs. j. Projection of the t-SNE of the Mouse Dormant HSCs signature. The colour bars indicate log2-normalized expression. k. The enrichment of GPRC5Cpos-HSCs in clusters 4 and 8 is 20.4% compared to 1.6% for GPRC5Cneg-HSCs. l. t-SNE of stem- and activation-associated genes. The colour bars indicate log2-normalized expression. m. t-SNE of KEGG and GO pathways. The colour bars indicate log2-normalized expression. n. Representative FACS histogram of OP-Puro MFI in BM GPRC5Cpos/neg-HSCs. All data presented as mean ± SD. Statistical significance was determined using two-tailed t-test (c, e, f) and at least two independent experiments were performed. ns, not significant. n indicates number of replicates. Source numerical data are available in source data.

