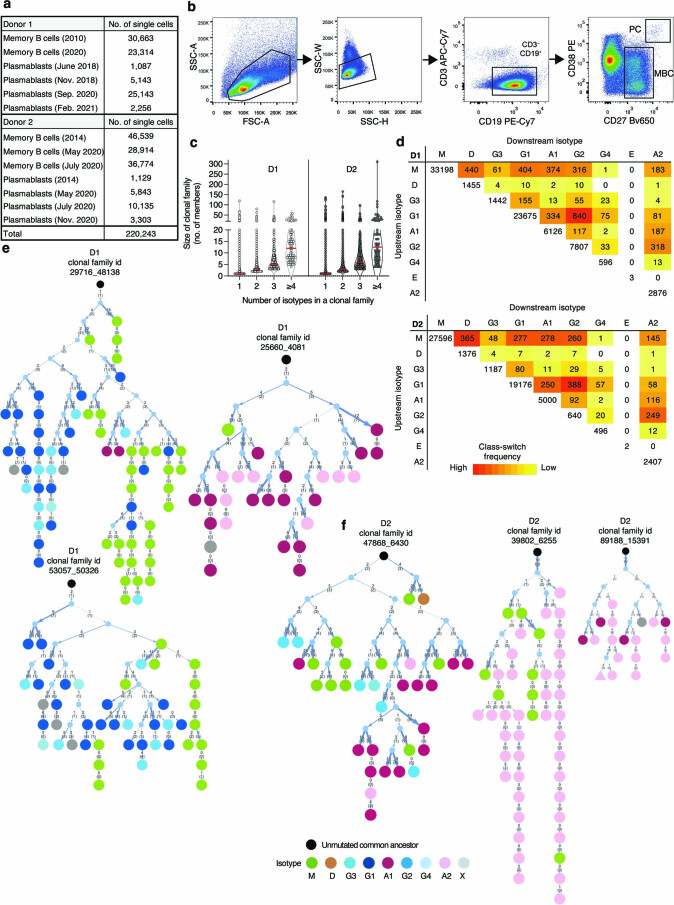
Extended Data Fig. 1. Isotype distribution and switching in memory B cell clonal families.
a, The table shows the number of single memory B cells (MBCs) and plasmablasts (PBs) profiled from different time points from D1 and D2. b, Representative flow cytometry plots showing gating strategy for MBC and PB populations. c, Size distribution of MBC clonal families in D1 and D2 comprising one or more isotypes. Red lines show median values. d, Class-switch propensity matrices show the number of clonal families having clones of each possible upstream and downstream isotype pair. The number on the diagonal shows the families having a single isotype (not colored). e,f, Representative genealogic trees depicting the class-switching in clonal families from D1 and D2. The number of somatic mutations at nucleotide and at amino acid (in parenthesis) levels are indicated on individual branches of the trees. The vertical thin dotted lines without arrowheads connect cells with identical VH/VL sequences. The thickness of the arrows reflects the number of mutations. The order of isotypes in the branches of the family trees does not represent class-switching sequence. A comprehensive set can be found in the RepSeq Playground.

