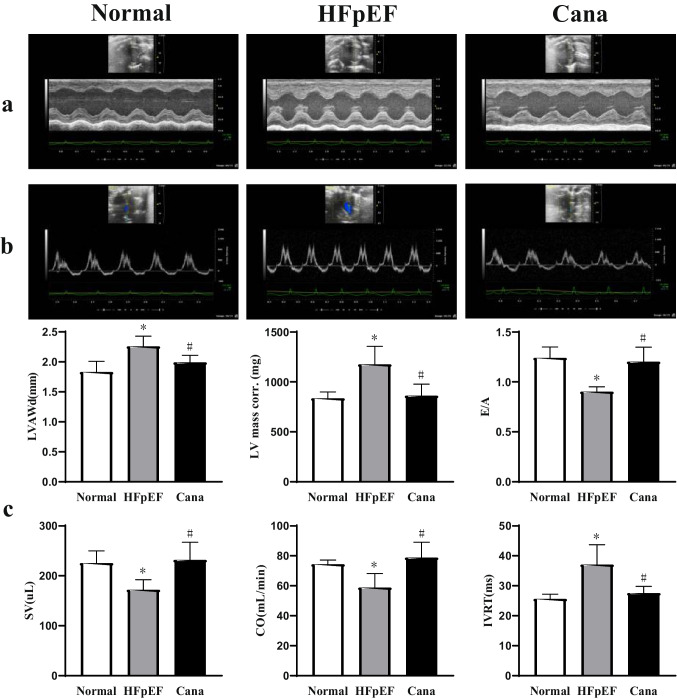
Fig. 3.
Echocardiographic assessment of LV structural and functional data in rats. a–b Echocardiographic representative M-mode and pulse-wave Doppler images to visualize myocardium structure. c Canagliflozin mitigated LV function in HFpEF rats indicated by LVAWd, LV mass corr., E/A, SV, CO, and IVRT. n = 6 rats/group. Data are presented as mean ± standard deviation. *p < 0.05 versus normal group. #p < 0.05 versus HFpEF group. LVAWd, left ventricular anterior wall in diastole; LV mass corr., left ventricular mass corrected; E/A, early diastolic filling to atrial filling velocity ratio of mitral flow; SV, stroke volume; CO, cardiac output; IVRT, isovolumic relaxation time

