Fig. 4.

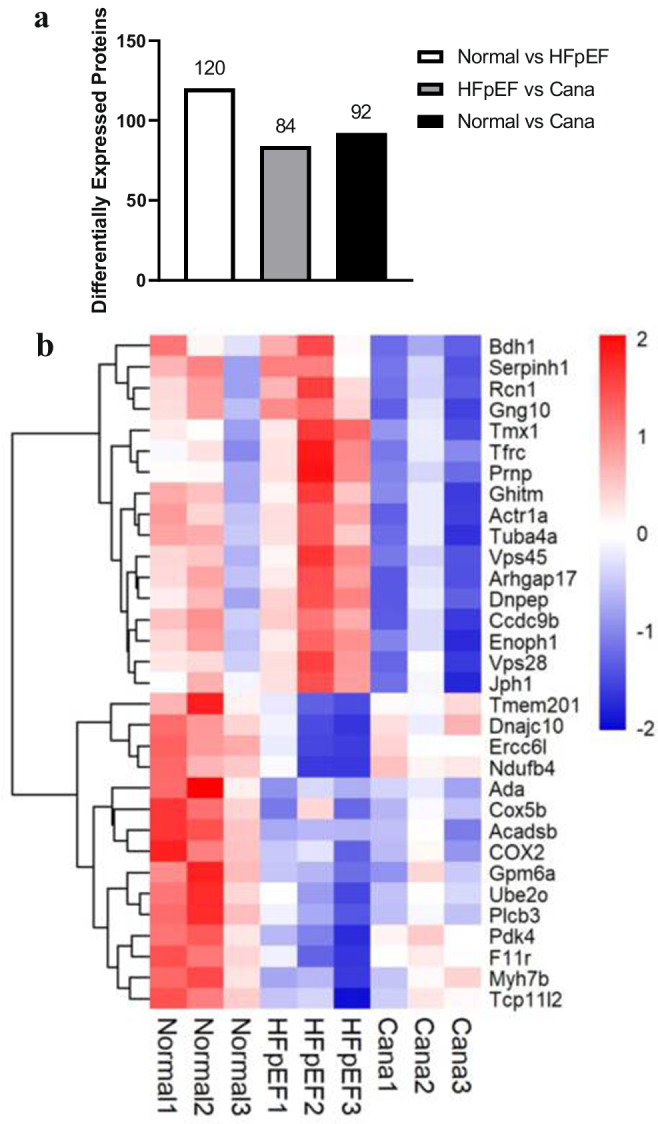
Proteomics was performed in cardiac tissues. a The column diagram was used to observe and analyze the differentially expressed proteins among three groups. b The heatmap illustrated 32 proteins with significant differences among three groups

Proteomics was performed in cardiac tissues. a The column diagram was used to observe and analyze the differentially expressed proteins among three groups. b The heatmap illustrated 32 proteins with significant differences among three groups