
Figure 4: Clinical performance evaluation phase of a NATRR model for predicting the resistance to NAT in ESCC patients in serum specimens.
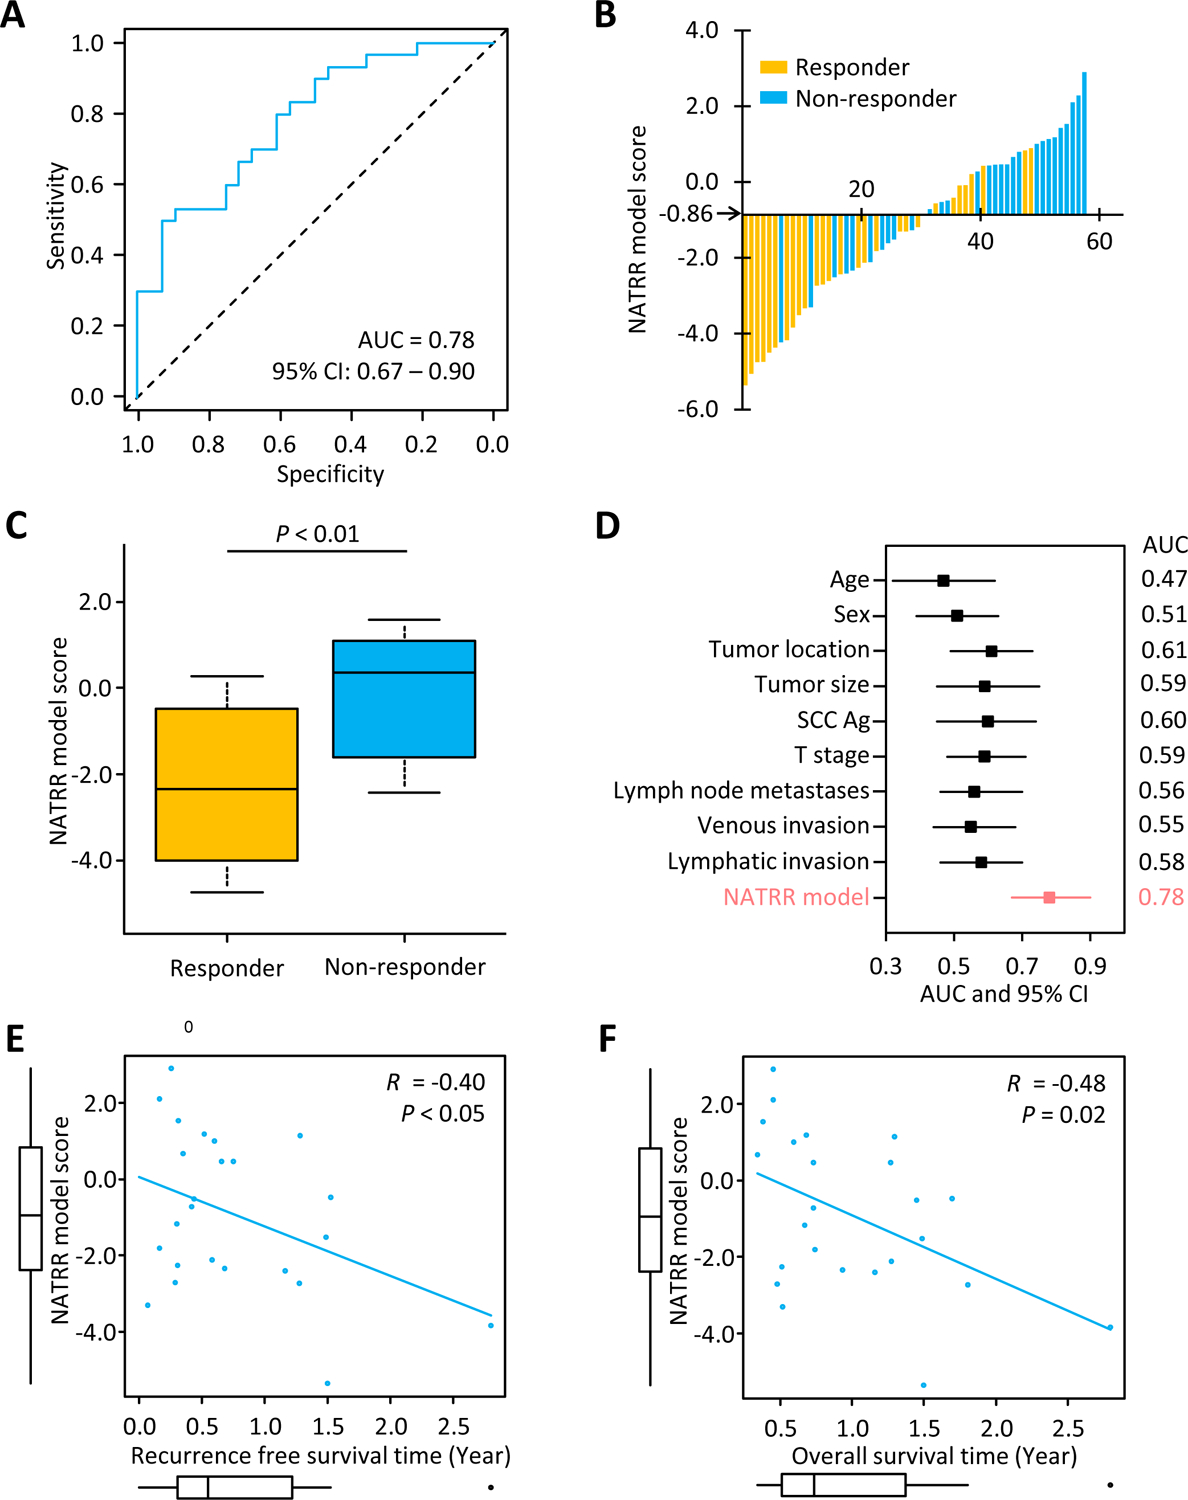
(A) Receiver operating characteristics curve values for NATRR model score in the clinical performance evaluation cohort (n = 58). (B) Waterfall plot represents the NATRR model score in the clinical performance evaluation cohort. (C) Box plots representing the NATRR model score in the performance evaluation cohort. (D) Forest plot with AUC of NATRR model and key clinicopathological factors to predict response to NAT in ESCC patients. (E) Pearson’s correlation of a NATRR model score and recurrence-free survival time in patients experienced recurrence (R = −0.40, P = 0.05). (F) Pearson’s correlation of a NATRR model score and overall survival time in patients experienced recurrence (R = −0.48, P = 0.02). AUC, area under the curve; CI, confidence interval; NAT, neoadjuvant therapy; SCC Ag, squamous cell carcinoma antigen.