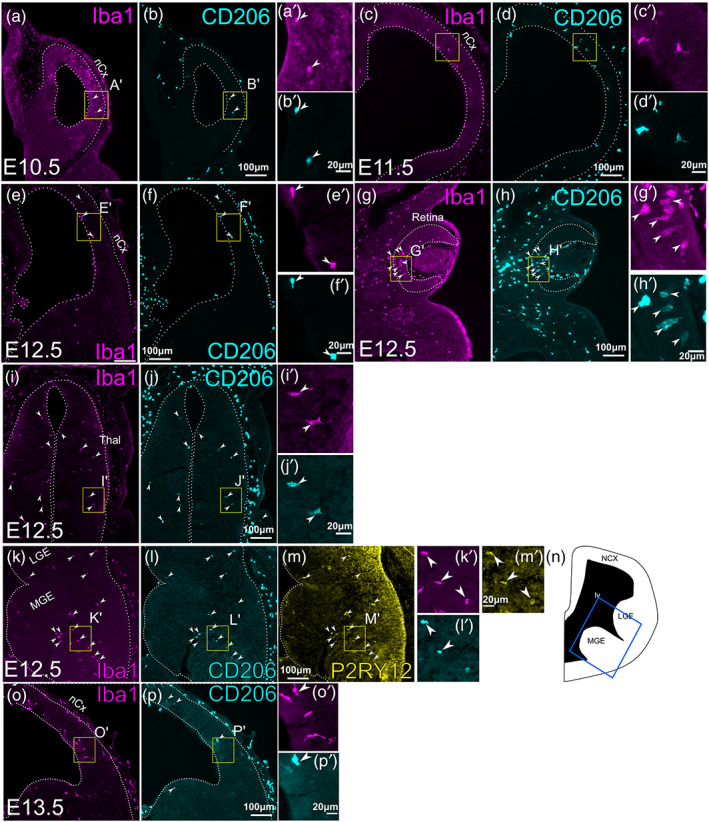
FIGURE 1.

Expression of CD206 in early CNS parenchyma. (a–l) Double immunostaining of Iba1 and CD206 on frontal sections of mouse embryos at E10.5 (a,b), E11.5 (c,d), and E12.5 (e–j). Various CNS regions are shown for E12.5. (e,f) Telencephalon, (g,h); retina, (i,j); thalamus. All images show the right side of the section. Arrowheads indicate cells that express both Iba1 and CD206. (k–m). Triple immunostaining of Iba1 (k) CD206 (l) and P2RY12 (m) at E12.5 within ganglionic eminences. Arrowheads indicate cells that express all three markers. (n) is a schematic that shows the approximate location of (k–m) in E12.5 telencephalon (blue box). (o,p) Double immunostaining of Iba1 and CD206 on frontal sections of mouse embryos at E13.5. Unlike at E10.5, E11.5 and E12.5, E13.5 CNS has few cells that express both Iba1 and CD206 (arrowheads), despite an increased density of Iba1+ cells. For all panels except N, a high‐magnification image is shown (e.g., a' for a). The location of each high‐magnification image is shown as a yellow box in each panel. nCx, neocortex; Thal, thalamus; MGE, medial ganglionic eminence; LGE, lateral ganglionic eminence; lv, lateral ventricle.
