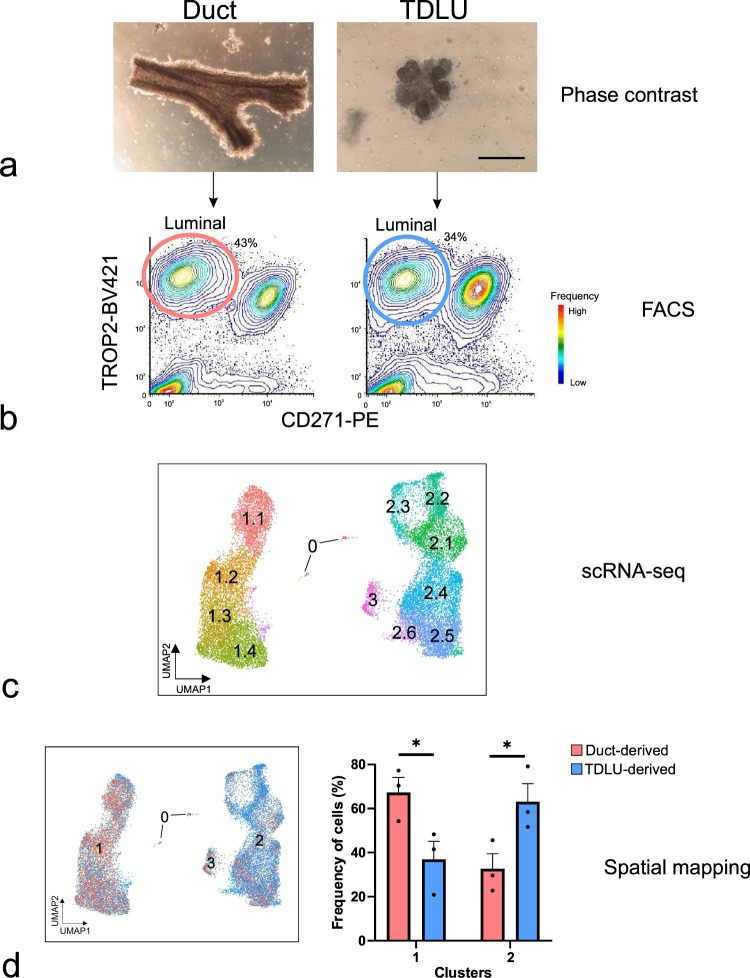
Fig. 1. Combined micro-collection, FACS, and scRNA-seq assign duct- and TDLU-derived cells to separate clusters.
a Phase-contrast micrographs of micro-collected ducts (left) and TDLUs (right) from human breast organoids. Scale bar = 100 μm. b FACS diagrams showing the gating of luminal cells (TROP2+/CD271−) from ducts (red circle, left) and TDLUs (blue circle, right) for scRNA-seq. Colors in FACS diagrams indicate frequency (red = high, blue = low frequency). c Uniform Manifold Approximation and Projection (UMAP) plot showing the clustering of luminal cells of three age-matched biopsies (20,286 cells). Clusters are denoted by color and labeled in the plot. Clusters: 0 as immune cells, 1.1–1.4 as luminal progenitors, and 2.1 to 2.6 and 3 as mature luminal cells according to differentially expressed genes (DEGs), some of which are shown in Fig. 2a. d (left) Same UMAP plot as in c showing contribution of duct- (red) and TDLU-derived (blue) luminal cells. (right) Bar graph illustrating contribution (relative frequency of cells in percent) of duct- (red) and TDLU-derived (blue) luminal cells to groups 1 and 2 of clusters. Error bars represent mean + standard error of the mean (SEM), n = 3 biopsies. *p < 0.05 by two-tailed t-test. Source data are provided as a Source Data file.

