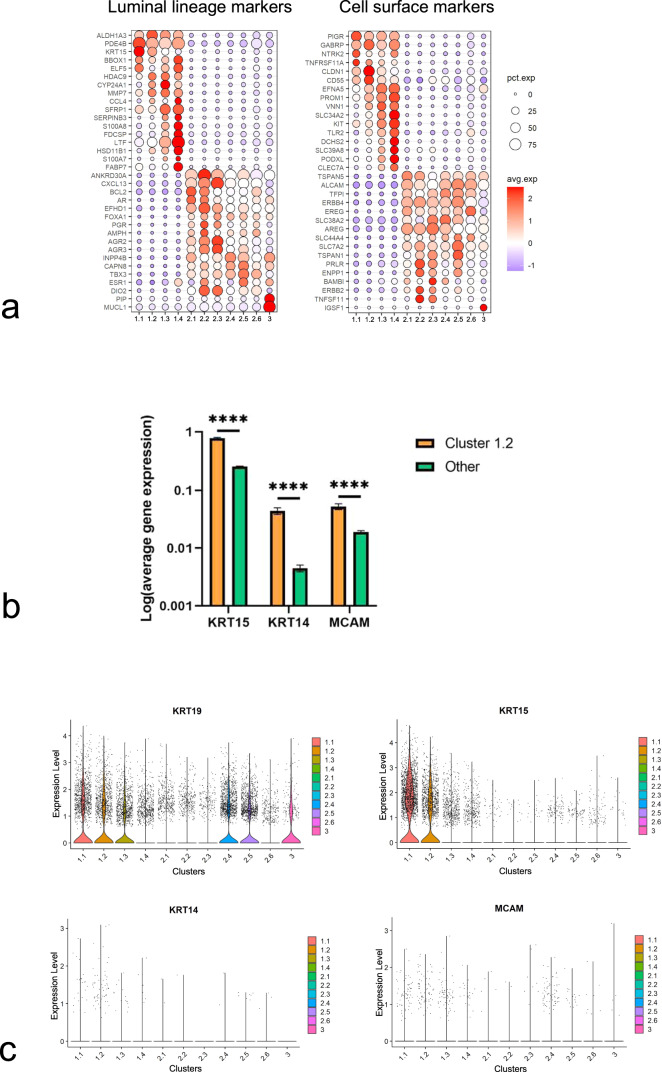
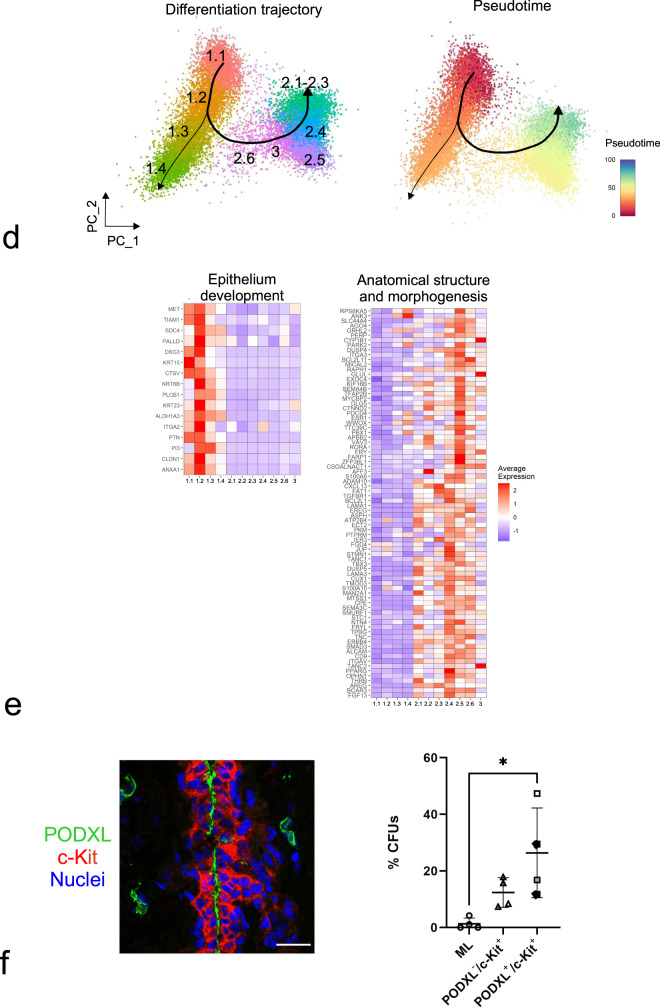
Fig. 2. The ductal-enriched clusters 1.1–1.4 include immature progenitors.
a Bubble plots showing a subset of cluster-specific DEGs of luminal lineage markers (left) and DEGs encoding cell-surface proteins (right). Circle size denotes the percentage of cells expressing the gene in each cluster, while color indicates the average expression level (red = high expression, blue = low expression). b Bar graph showing log-transformed gene expression of KRT15, KRT14, and MCAM in cluster 1.2 (orange) and in the other clusters (green). Error bars represent mean ± SEM. ****p < 0.001 by multiple two-tailed t-tests using False Discovery Rate (FDR) for multiple comparisons. c Violin plots showing expression of KRT19, KRT15, KRT14, and MCAM in all luminal clusters. d Principal component (PC) plots showing the trajectories of luminal differentiation (left) and pseudotime (right) using principal curves. Colors denote clusters (left) and pseudotime (right). The origin and endpoints were identified without supervision. Slingshot inferred cluster 1.1 as the origin and arrow heads indicate endpoints. e Heat maps showing expression of genes related to epithelium development (adj p < 0.001, g: Profiler analysis, left) and anatomical structure and morphogenesis (adj p < 0.0001, g:Profiler analysis, right) in the luminal clusters. f (left) Representative fluorescence multicolor imaging of normal breast stained for PODXL (green), c-Kit (red), and nuclei (blue). Scale bar = 25 μm. (right) Dot plot showing percentage of colony-forming units (CFUs) per 96 well-plate of sorted PODXL−/c-Kit- mature luminal (ML), PODXL−/c-Kit+, and PODXL+/c-Kit+ luminal cells. Filled squares indicate PODXL+/c-Kit−/+. PODXL+ cells form significantly more colonies compared to ML cells (n = 4 biopsies). Error bars represent mean ± standard deviation (SD). *p < 0.05 by Kruskal–Wallis test with Dunn’s multiple comparisons test. Source data are provided as a Source Data file.


