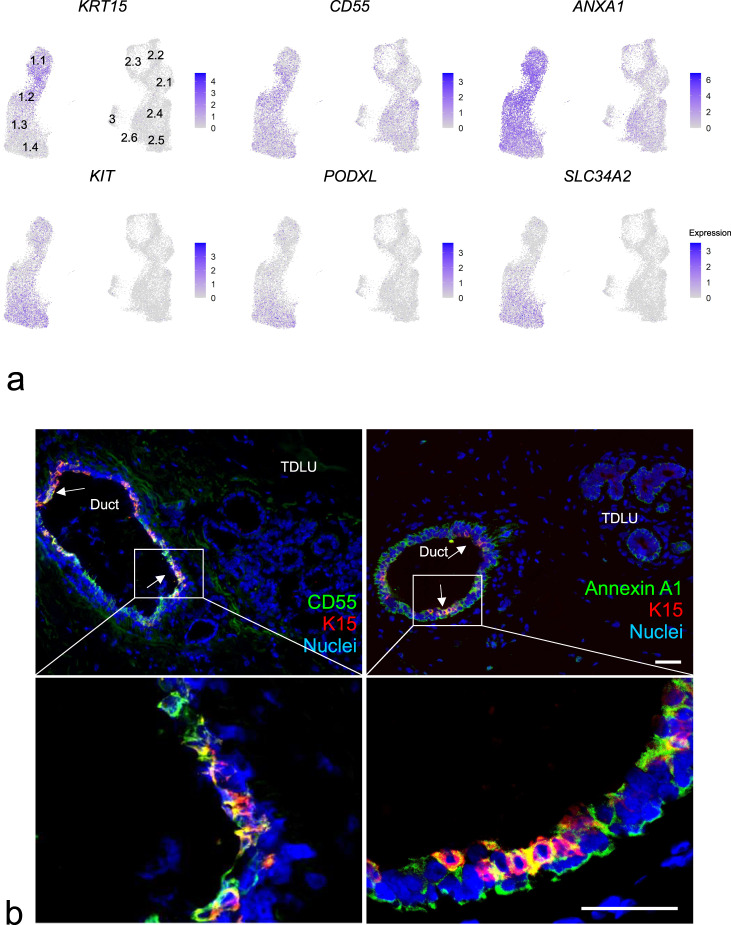
Fig. 3. Cluster 1.2-associated CD55, annexin A1, and K15 preferentially localize to ducts.
a Feature plots showing highest expression of KRT15, CD55, and ANXA1 (annexin A1) in the area of cluster 1.2 and highest expression of KIT, SLC34A2, and PODXL in the area of cluster 1.4. b Representative fluorescence multicolor imaging of cryostat sections of normal breast stained for CD55 or annexin A1 (green) and K15 (red), and nuclei (blue). Arrows indicate CD55+/K15+ or annexin A1+/K15+ luminal cells. Images with higher magnification of selected areas (white squares) are shown below. Note that annexin A1 also stains myoepithelial cells. Annexin A1 and CD55 staining colocalizes with K15 preferentially in ductal luminal cells. Scale bars = 50 μm.

