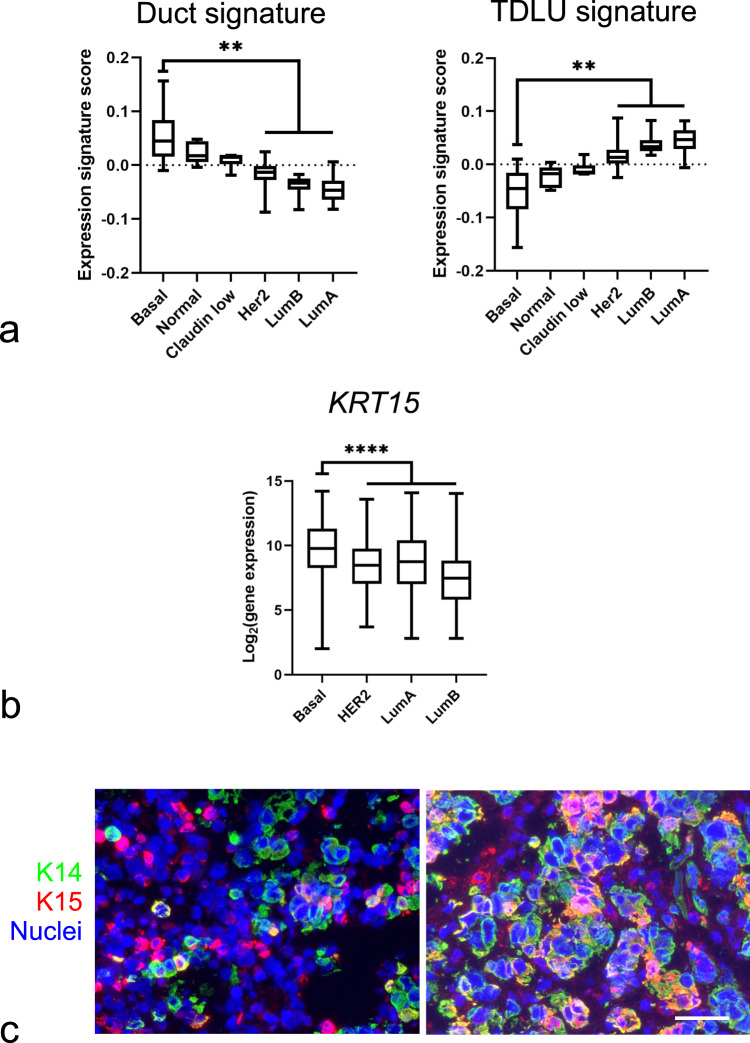
Fig. 4. Correlation between expression profiles of duct- and TDLU-derived normal luminal cells and breast cancer subtypes.
a Whisker box plots of expression signature scores comparing DEGs of duct- (left) and TDLU-derived (right) luminal cells with gene expression profiles of different breast cancer subtypes (basal-like (Basal), normal-like (Normal), Claudinlow (Claudin low), HER2-enriched (Her2), luminal type B (LumB), and luminal type A (LumA)). Boxes represent median ± quantiles. Whiskers indicate the minimum and maximum values. **p < 0.01 by Kruskal–Wallis test with Dunn’s multiple comparisons test. b Whisker box plot showing KRT15 gene expression in the different breast cancer subtypes. KRT15 is significantly upregulated in basal-like breast cancer compared to the other breast cancer subtypes (n = 2164, GENT2 database). Boxes represent median ± quantiles. Whiskers indicate the minimum and maximum values. ****p < 0.001 by one-way ANOVA with Tukey’s multiple comparison test. Source data are provided as a Source Data file. c Representative fluorescence multicolor imaging of cryostat sections of basal-like breast carcinomas stained for K15 (red), K14 (green), and nuclei (blue). Nine out of 36 basal-like breast carcinomas stained positive for both K15 and K14. Scale bar = 50 μm.

