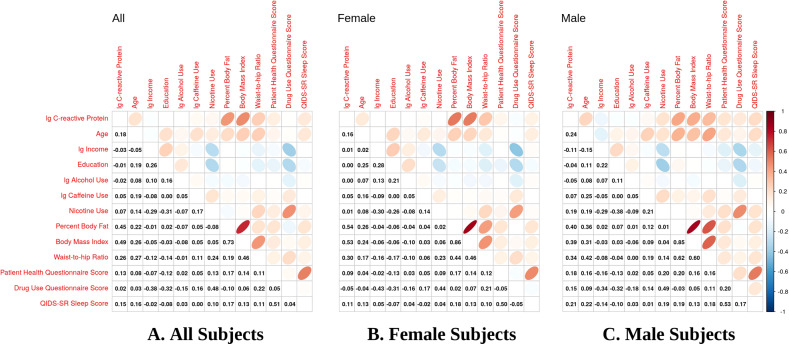
Fig. 1. Pearson correlation coefficient plots for CRP and covariates.
The plots show the Pearson correlation coefficients for A the combined male and female sample (All), B female-only sample, and C male-only sample. The ellipses are the visualizations for the corresponding Pearson correlation coefficients. Positive correlation is displayed in blue with slope of 1 and negative correlation is in red color with slope of −1. The color intensity and the eccentricity of the ellipse are proportional to the absolute value of correlation coefficient. For Pearson correlation coefficients of 0.1 or greater, CRP was positively correlated for A All subjects with age (r = 0.18), caffeine use (r = 0.05), nicotine use (r = 0.07), body mass index (BMI) (r = 0.49), percent body fat (PBF) (r = 0.45), waist-to-hip ratio (WHR) (r = 0.26), PHQ score (r = 0.13), and QIDS-SR Sleep score (r = 0.15); B Female subjects with age (r = 0.16), caffeine use (r = 0.05), BMI (r = 0.53), PBF (r = 0.54), and WHR (r = 0.30), PHQ (r = 0.09), and QIDS-SR (r = 0.11); and C Male subjects with age (r = 0.24), caffeine use (r = 0.07), nicotine use (r = 0.19), BMI (r = 0.39), PBF (r = 0.40), WHR (r = 0.34), PHQ score (r = 0.18), DAST score (r = 0.15), and QIDS-SR Sleep score (r = 0.21).

