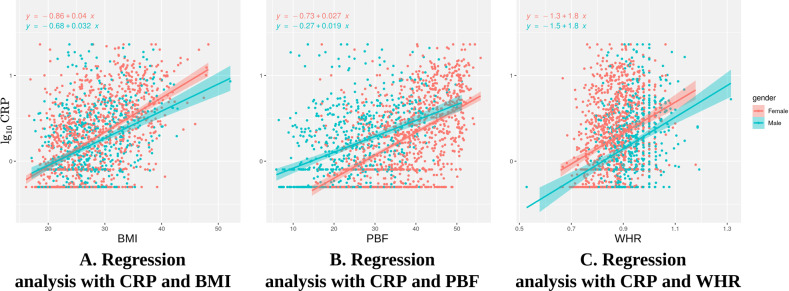
Fig. 3. Linear regression plots for C-reactive Protein (CRP) versus Body Mass Index (BMI), Percent Body Fat (PBF), and Waist-to-Hip Ratio (WHR).
The plots show the effect of the potential confounding variable [sex—female (pink); male (green)] on the regression analysis of the relationship between CRP and obesity indices (BMI, PBF, and WHR). A The regression plot shows that when controlling for BMI, CRP is higher in females compared to males. B The regression plot shows that when we control for PBF, CRP is higher in males compared to females. C The regression plot shows that when we control for WHR, CRP is higher in females compared to males.

