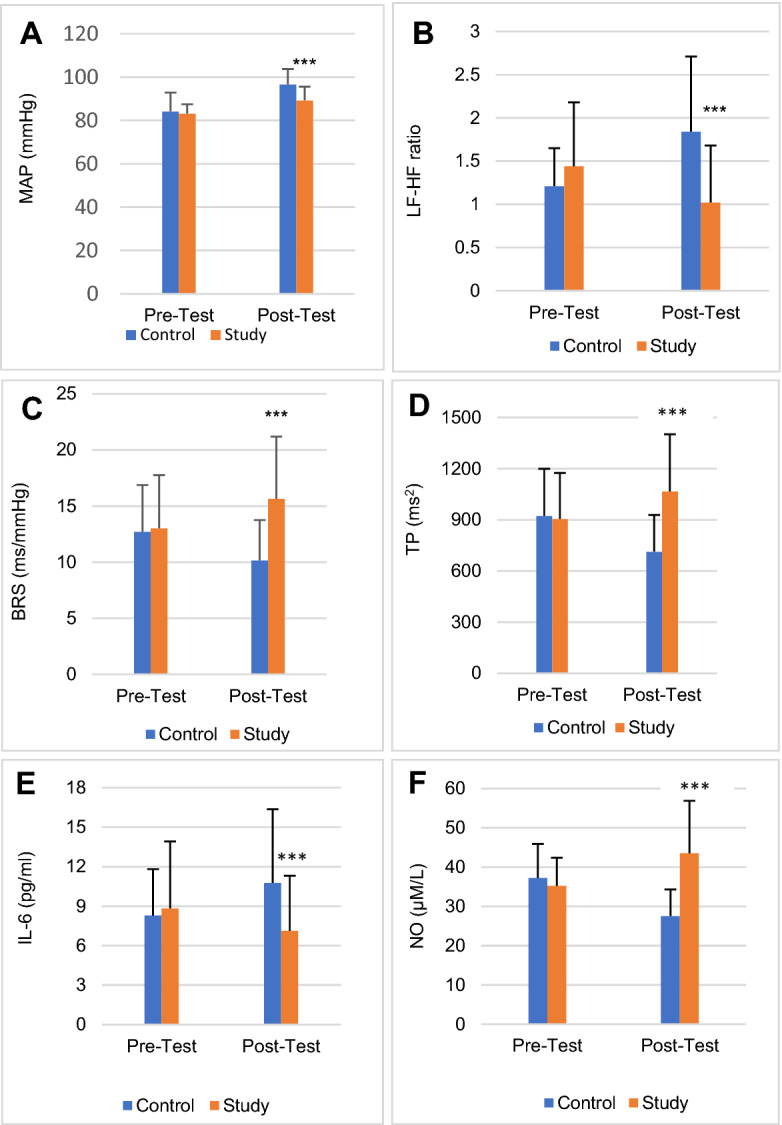
Figure 16.

Comparison of MAP (A), LF-HF ratio (B), BRS (C), TP (D), IL-6 (E) and NO (F) in control and study groups before and after intervention. Results are shown as Mean ± SD. There was no significant difference in any of the parameters between control and study groups before yoga intervention (Pre-Test). Following intervention (Post-Test), MAP, LF-HF ratio and IL-6 were significantly decreased and BRS, TP and NO were significantly increased in the study group compared to the control group. ***p < 0.001.
