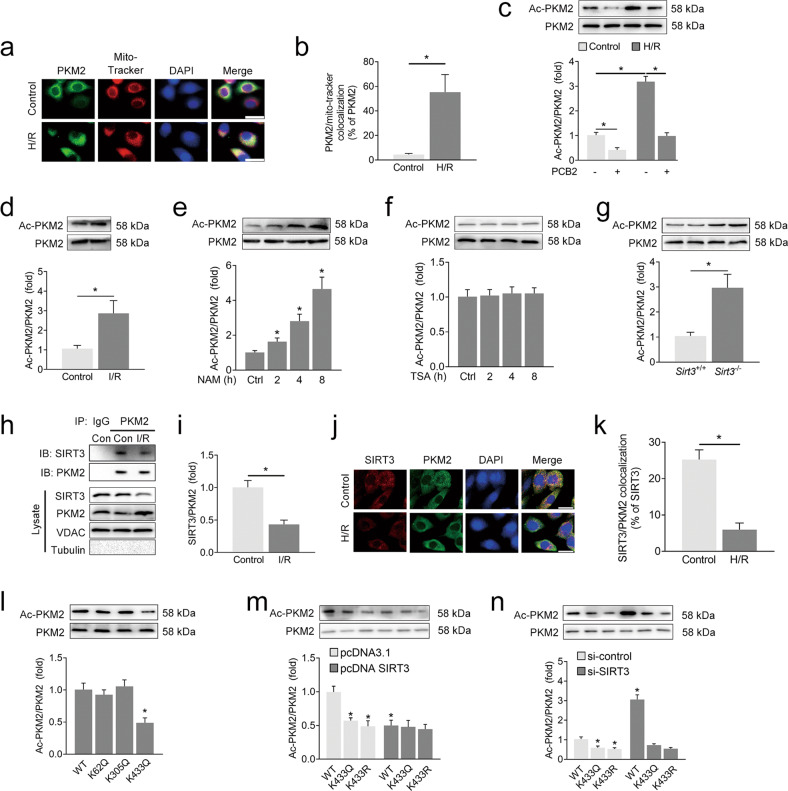
Fig. 6. SIRT3 deacetylates PKM2 at the K433 site in the mitochondria.
a, b A549 cells were subjected to 6 h of hypoxia followed by 2 h of reoxygenation to induce H/R injury. Immunofluorescence analyses were performed using anti-PKM2 antibodies or MitoTracker probes. Representative images are shown in (a). Scale bar = 25 μm; colocalization data are shown in (b). c, d A549 cells were pretreated with PCB2 (20 μM) for 24 h and subjected to 6 h of hypoxia followed by 2 h of reoxygenation (H/R); C57BL/6 mice were subjected to 1 h of ischemia followed by 2 h of reperfusion to establish lung I/R injury. Level of acetylated PKM2. n = 3. e, f Level of acetylated PKM2 in A549 cells after treatment with NAM (10 mM) or TSA (0.5 μM) for 2 to 8 h, n = 3. g Level of acetylated PKM2 in the lungs from the Sirt3 wild-type (Sirt3+/+) or Sirt3 knockout (Sirt3-/-) mice, n = 3. h, i Representative coimmunoprecipitation blots showing the interaction of SIRT3 with PKM2 in the lungs from the control (Con) or I/R mice. The lysate represents the mitochondrial protein extracts used for immunoprecipitation. IB, immunoblotting; IP, immunoprecipitation; IgG, negative control. n = 3. j, k A549 cells were subjected to 6 h of hypoxia followed by 2 h of reoxygenation to induce H/R injury. Immunofluorescence analyses were performed using anti-SIRT3 or anti-PKM2 antibodies. Representative images are shown in (j). Scale bar = 25 μm; colocalization data are shown in (k). l PKM2 acetylation in A549 cells transfected with acetylation site-specific mutants of PKM2, n = 3. m A549 cells were cotransfected with acetylation site-specific mutants of PKM2 and a SIRT3 expression plasmid (pcDNA SIRT3) or negative control (pcDNA3.1). Levels of acetylated PKM2. n = 3. n A549 cells were cotransfected with acetylation site-specific mutants of PKM2 and an siRNA targeting SIRT3 (si-SIRT3) or negative control (si-control). Levels of acetylated PKM2. n = 3. *p < 0.05 compared with the first group or the indicated group. Error bars depict the standard deviations.

