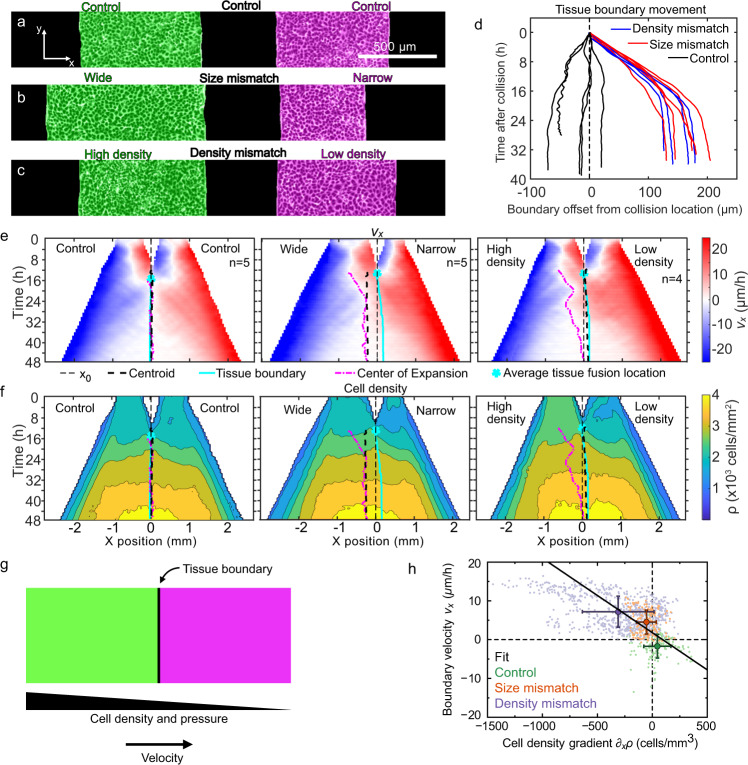
Fig. 2. Asymmetric tissue collisions produce boundary motion.
a–c Initial condition of collisions between control (a), size mismatch (b), and density mismatch (c) rectangle tissue pairs. Micrographs are representative of n = 5 (control), n = 5 (size mismatch), and n = 4 (density mismatch) independent experiments with similar results. d Tissue boundary displacement in both mismatch and control collisions. e, f Kymographs of tissue velocity vx (e) and cell density (f) along the collision direction for control (left, n = 5), size mismatch (center, n = 5), and density mismatch (right, n = 4) collisions. The superimposed curves indicate initial midline location x0 (thin black dashed line), the geometric tissue centroid (thick black dashed line), the tissue boundary (cyan line), and the center of expansion (pink dash-dotted line), as defined in the text and Methods. The cyan star marks the average tissue fusion location, which occurs at the initial point of the tissue boundary line. Panels d–f are from the same data set. g Our model proposes that the tissue boundary moves driven by pressure gradients between tissues of different cell densities. h Consistent with our model, the velocity and the cell density gradient at the tissue boundary are negatively correlated (correlation coefficient r = −0.47). Small points represent individual data, big points correspond to the averages for each of our three assays, and the black line is a linear fit through the averages. This plot includes data from experiments with initial density mismatches higher than in panels d–f. The range of applicability of our model extends to all of these density mismatches (additional n = 16, Supplementary Figs. 4 and 5). Error bars are standard deviation. See Supplementary Videos 5 and 6.

