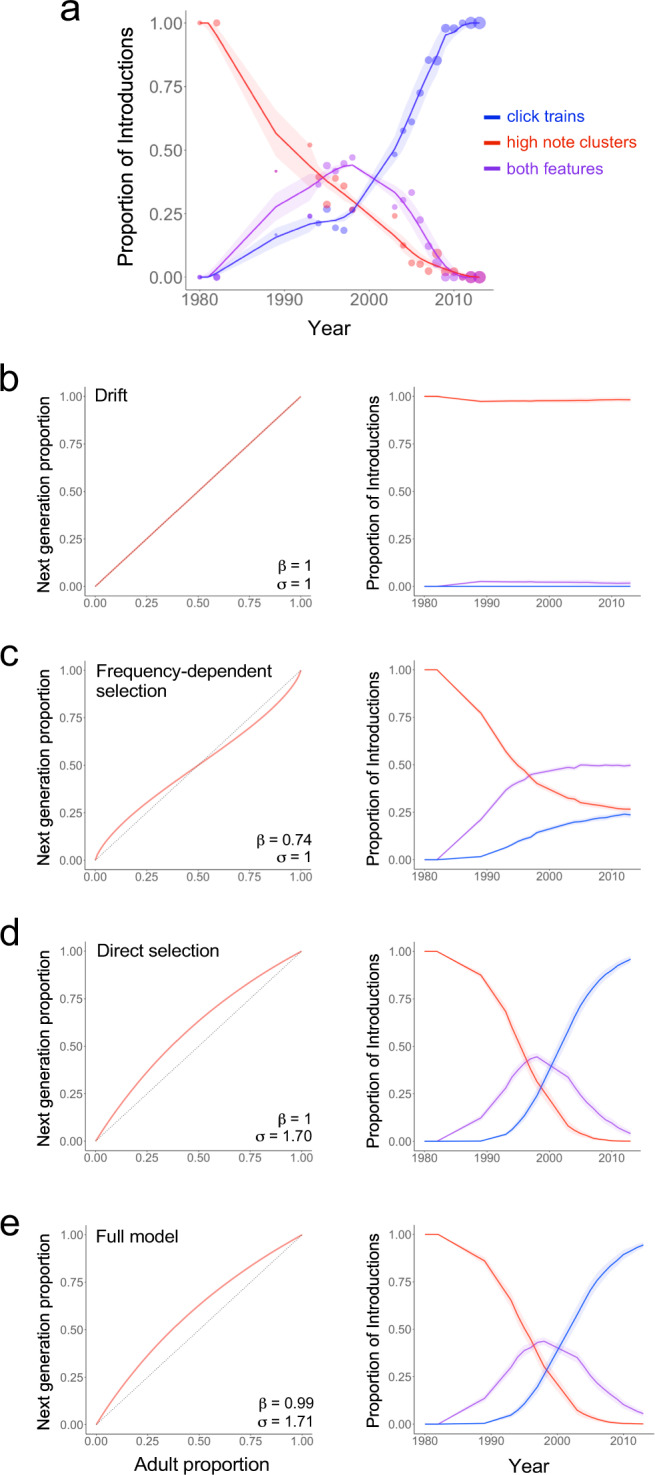
Fig. 4. Modeling replacement of high note clusters by click trains.

a Historical data showing proportions of songs with high note clusters (red), both high note clusters and click trains (purple), and click trains alone (blue). Point sizes are proportional to numbers of songs recorded in a given year, solid lines are splines fitted to each category, and shading represents the 95% confidence interval. b–e The learning curves (left) and outputs of model (right, with 95% confidence interval error bands) and the frequency-dependent bias and/or selection parameters that generated the best fit to the historical data for each type of model. b Cultural drift model. c Best-fitting frequency-dependent learning bias model (β=0.74 represents a moderate rare-form bias). d Best-fitting selection model (σ = 1.70 represents moderate to strong selection for click trains). e Best-fitting full model that simultaneously varied selection and frequency-dependent bias. The best version of this model is nearly identical to (d) with essentially no frequency-dependent bias (β = 0.99 ≈ 1.0 = no frequency-dependent learning) and moderate to strong selection (σ = 1.71). Source data are provided in the Source Data file.
