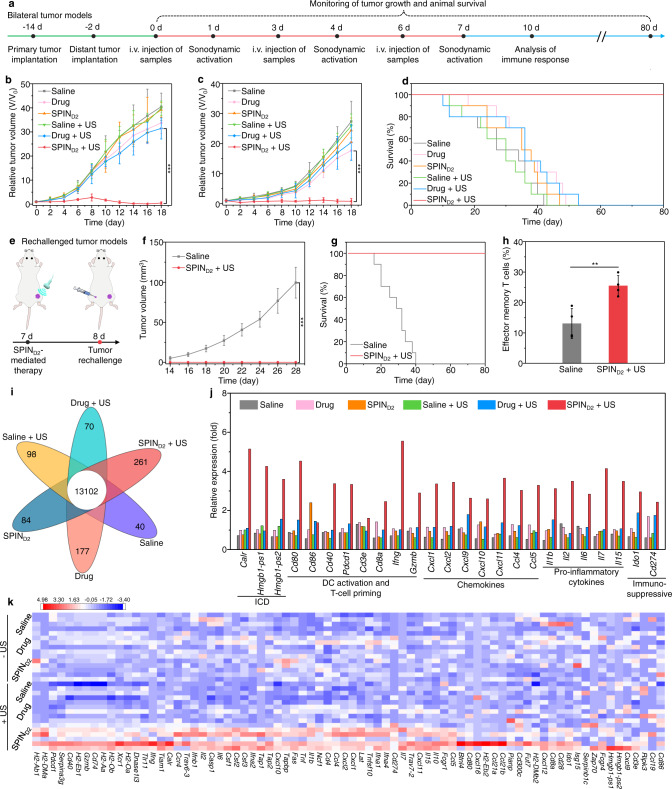
Fig. 4. Evaluation of SPIN-mediated sono-immunotherapy in Panc02 tumor mouse model.
a Schedule for the establishment of primary and distant tumors, triple systemic injection of SPINs (0.2 mL, 0.6 mg/mL) via tail vein, US irradiation (1.0 MHz, 1.2 W/cm2, 50% duty cycle, 10 min), and analysis of immune responses. b, c Relative tumor volumes of primary (b) and distant (c) tumors of Panc02 tumor-bearing C57BL/6 mice (n = 6) after systemic injection of saline, free-drug mixture (on day 0, 3, and 6, 4 mg/kg body weight for NLG919 and aPD-L1), or SPIND2 (0.2 mL, 0.6 mg/mL) with or without US irradiation (1.0 MHz, 1.2 W/cm2, 50% duty cycle, 10 min). SPIND2 + US versus drug + US: P < 0.0001 for primary tumors (b); SPIND2 + US versus drug: P < 0.0001 for distant tumors (c). d Survival curves of Panc02 tumor-bearing C57BL/6 mice (n = 10) receiving different treatments as indicated. e Schematic illustration of treatment of rechallenged tumor mouse models using SPINs. f Growths of rechallenged tumors in Panc02 tumor-bearing mice after injection of saline or SPIND2 (0.2 mL, 0.6 mg/mL) with US irradiation (1.0 MHz, 1.2 W/cm2, 50% duty cycle, 10 min) (n = 5). Saline versus SPIND2 + US: P < 0.0001. g The survival curves of Panc02 tumor-bearing C57BL/6 mice after different treatments followed by tumor rechallenge (n = 10). h Flow cytometry analysis of populations of effector memory T cells in the spleen of Panc02 tumor-bearing C57BL/6 mice after different treatments followed by tumor rechallenge (n = 4). Saline versus SPIND2 + US: P = 0.0059. i Differentially expressed gene numbers in tumor tissues of mice after different treatments. j Relative expression of Carl, Hmgb1-ps1, Hmgb1-ps2, Cd80, Cd86, Cd40, Pdcd1, Cd3e, Cd8a, Ifng, Gzmb, Cxcl1, Cxcl2, Cxcl9, Cxcl10, Cxcl11, Ccl4, Ccl5, Il1b, Il2, Il6, Il7, Il15, Ido1, and Cd274 in tumors of Panc02 tumor-bearing mice after different treatments (the experiment was repeated independently five times with similar results). k Unsupervised hierarchical clustering of relative gene expression in tumors of Panc02 tumor-bearing C57BL/6 mice after different treatments (n = 5). Data are presented as mean values ± SD. Statistical significance was calculated via two-tailed Student’s t test; **P < 0.01, ***P < 0.001. Source data are provided as a Source Data file.

