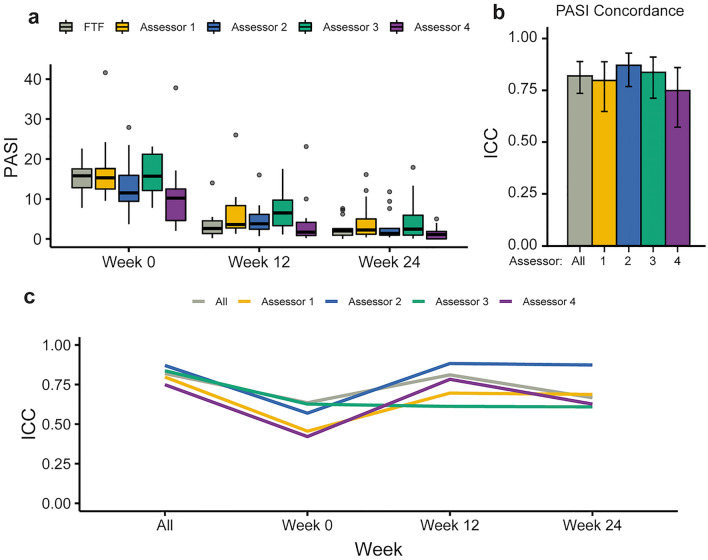
Fig. 2.
Overall PASI score distribution and assessor concordance. a Box plots showing distribution and range of PASI scores recorded by the face-to-face (FTF, gray) and four image-based assessors (numbered 1–4, colored). b Bar plots showing overall intraclass correlation (ICC, a measure of concordance) for each of the DIB-PASI assessors with the in-person assessor (colored bars), as well as a combined group concordance (gray bar). Error bars show 95% confidence interval. c Line plot showing ICC values across all time points, with colors corresponding to each of the assessors

