Fig. 1.
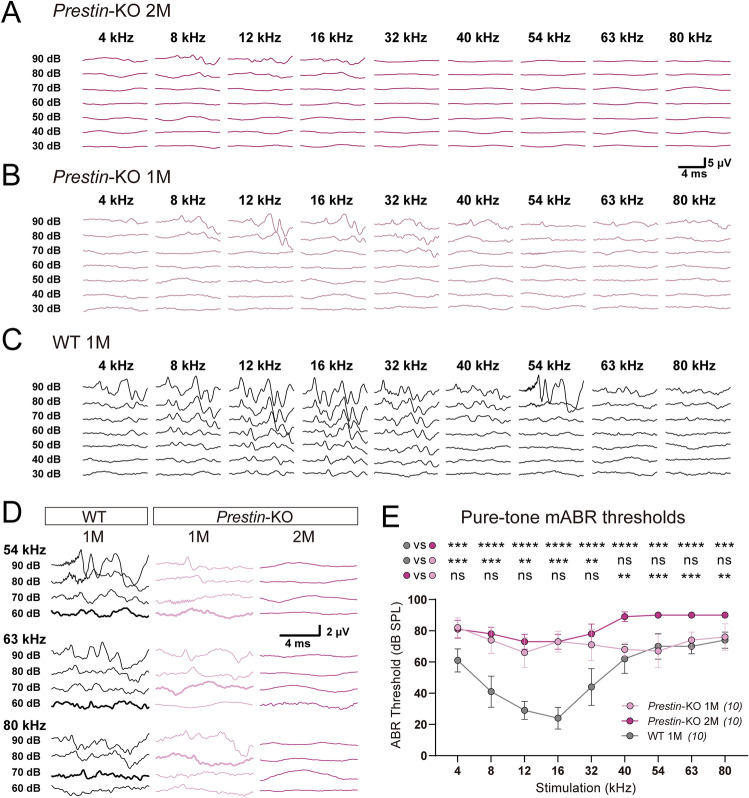
Prestin-knockout mice show distinct sensitivity at low and high frequencies. A Representative example of mABR signals in a 2-month-old (2M) Prestin-KO mouse. B Representative example of mABR signals in a 1-month (1M) Prestin-KO mouse. C Representative example of mABR signals in a 1-month (1M) WT C57BL/6 mouse. D Enlarged mABR traces with 54 kHz, 63 kHz, and 80 kHz sound stimuli in (A–C). Bold lines indicate visual thresholds. Peak at ~3 ms was used to identify the threshold for high frequencies. E Pure-tone mABR thresholds in Prestin-KO mice and control mice at designated ages. Note the distinct ABR thresholds to ultrasound frequencies between Prestin-KO mice at 1 month (1M, light purple) and Prestin-KO mice at 2 months (2M, purple). 1-month-old (1M) Prestin-KO mice vs control mice, Kruskal-Wallis test, 4 kHz, ***P = 0.0002; 8 kHz, ***P = 0.0006; 12 kHz, **P = 0.0026; 16 kHz, ***P = 0.0002; 32 kHz, **P = 0.0047; 40 kHz, P = 0.7802; 54 kHz, P >0.9999; 63 kHz, P = 0.9704; 80 kHz, P >0.9999. 2-month (2M) Prestin-KO mice vs control mice, Kruskal-Wallis test, 4 kHz, ***P = 0.0005; 54 kHz and 80 kHz, ***P = 0.0003; ****P <0.0001 at other frequencies. 1-month-old (1M) Prestin-KO mice vs 2-month-old (2M) Prestin-KO mice, Kruskal-Wallis test, 4 kHz, P >0.9999; 8 kHz, P > 0.9999; 12 kHz, P = 0.7182; 16 kHz, P >0.9999; 32 kHz, P = 0.734; 40 kHz, **P = 0.0016; 54 kHz, ***P = 0.0001; 63 kHz, ***P = 0.0009; 80 kHz, **P = 0.0013. Data are presented as the mean ± SD. N numbers are shown in panels.

