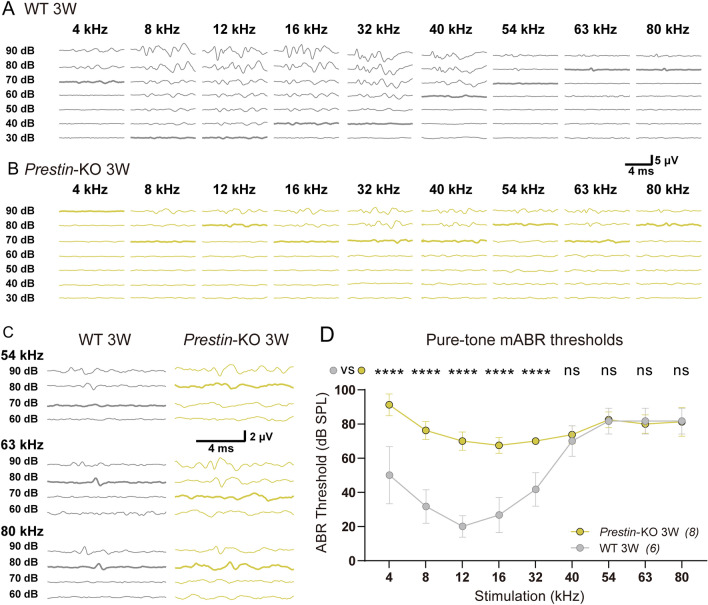
Fig. 4.
mABR measurements from 3-week-old (3W) Prestin-knockout mice. A Representative example of mABR signals in a 3W WT mouse. B Representative example of mABR signals in a 3W Prestin-KO mouse. C Amplified representative examples of mABR signals in response to 54–80 kHz, 60–90 dB SPL stimuli (visual thresholds bolded). The peak at ~3 ms is used to identify the threshold. D Pure-tone mABR thresholds in Prestin-KO and control mice at 3W. Groups are compared at each frequency. Prestin-KO mice vs control mice, Sidak’s multiple comparisons test, 4 kHz, ****P <0.0001; 8 kHz, ****P <0.0001; 12 kHz, ****P <0.0001; 16 kHz, ****P <0.0001; 32 kHz, ****P <0.0001; 40 kHz, P = 0.9824; 54 kHz, P >0.9999; 63 kHz, P >0.9999; 80 kHz, P >0.9999. Data are presented as the mean ± SD. N numbers are shown in panels.

