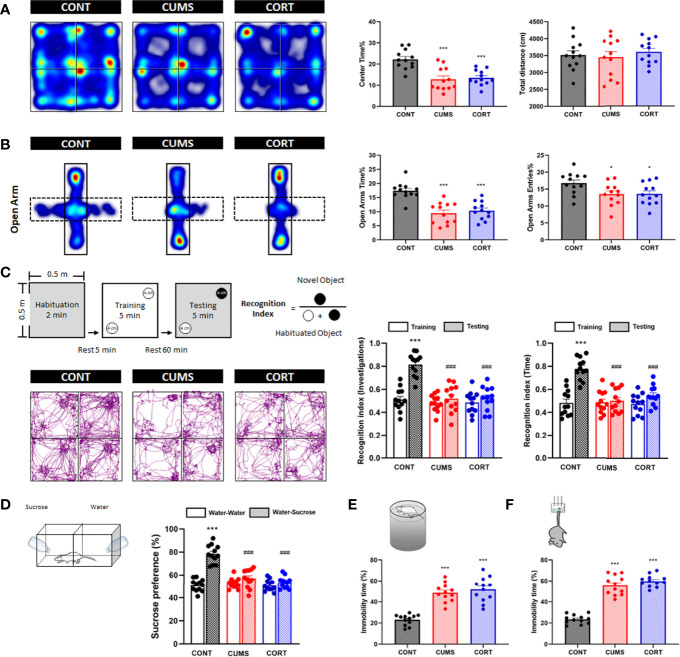
Figure 2.
Mice with chronic stress exhibited negative emotional behaviors. (A) Representative heat maps for CONT, CUMS, and CORT groups in OF test were presented, and center time% and total distance were analyzed (two-way ANOVA with Tukey’s post hoc test, ***P < 0.001, compared with CONT; n = 12). (B) Representative heat maps for CONT, CUMS, and CORT groups in EPM test were presented, and open arm time% and open arm entries% were analyzed (two-way ANOVA with Tukey’s post hoc test, *P < 0.05, ***P < 0.001, compared with CONT; n = 12). (C) Experimental protocol and representative trajectory images for CONT, CUMS, and CORT groups in NOR test were presented, and recognition index of investigations and time was analyzed (paired Student’s t-test, ***P < 0.001, compared with training. Two-way ANOVA with Tukey’s post hoc test, ### P < 0.001, compared with CONT-testing; n = 12). (D) Experimental protocol for SP test was presented, and sucrose preference was analyzed (paired Student’s t-test, ***P < 0.001, compared with water–water. Two-way ANOVA with Tukey’s post hoc test, ###P < 0.001, compared with CONT–water–sucrose; n = 12). (E) Experimental protocol for FS test was presented, and immobility time% was analyzed (two-way ANOVA with Tukey’s post hoc test, ***P < 0.001, compared with CONT; n = 12). (F) Experimental protocol for TS test was presented, and immobility time% was analyzed (Two-way ANOVA with Tukey’s post hoc testpost hoc, ***P < 0.001, compared with CONT; n = 12).

