Figure 4.
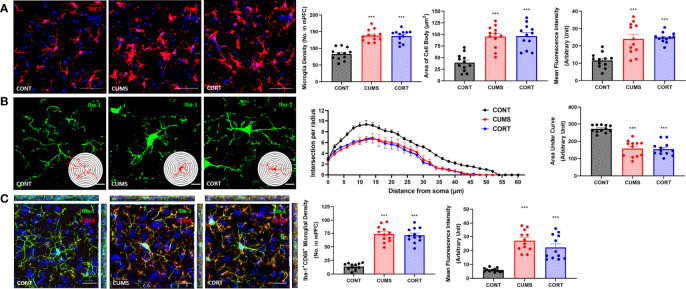
Mice with chronic stress were accompanied with microglial activation in mPFC. (A) Representative immunofluorescence images showing the Iba-1+ microglia in CONT, CUMS, and CORT groups were presented, and the microglial density, area of cell body, and the MFI of Iba-1 were analyzed (two-way ANOVA with Tukey’s post hoc testpost hoc, ***P < 0.001, compared with CONT. Two replica for n = 6). Scale bar: 40×. (B) Representative immunofluorescence images showing the 3D reconstruction of Iba-1+ microglia in CONT, CUMS, and CORT groups were presented, and Sholl analysis and their AUCs were analyzed (two-way ANOVA with Tukey’s post hoc testpost hoc, ***P < 0.001, compared with CONT. Two replica for n = 6). Scale bar: 126×. (C) Representative immunofluorescence images showing the co-localization of CD68+ and Iba-1+ microglia in CONT, CUMS, and CORT group were presented, and the Iba-1+CD68+ microglial density and also the MFI of CD68 were analyzed (two-way ANOVA with Tukey’s post hoc testpost hoc, ***P < 0.001, compared with CONT. Two replica for n = 6). Scale bar: 63×.

