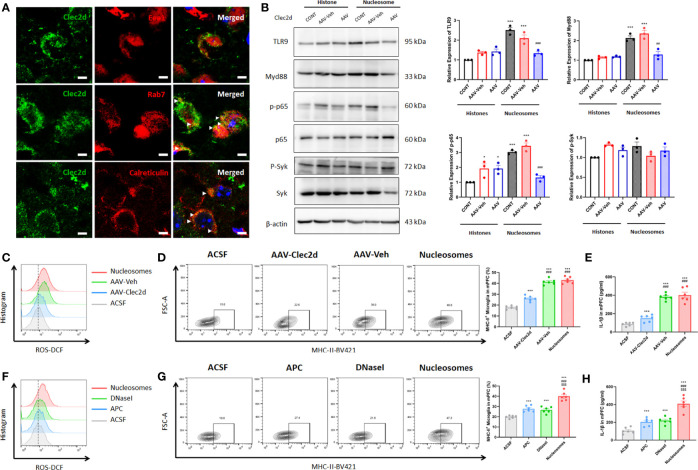
Figure 7.
Extracellular nucleosomes accelerated microglial inflammation via Clec2d and TLR9. (A) Representative immunofluorescence images showing the subcellular location of Clec2d and Eea1, Rab7, and calreticulin, as well as their relationship in primary microglia were presented. Scale bar: 150×. (B) Representative Western blots showing the expression of microglial TLR9, Myd88, p-p65, and p-Syk on 3 days after ACSF, histones, or nucleosomes stereotactic injection in mPFC with Clec2d knocking-down were presented. Relative expression of TLR9, Myd88, p-p65, and p-Syk on 3 days after ACSF, histones, or nucleosomes stereotactic injection in mPFC with Clec2d knocking-down was analyzed (two-way ANOVA with Tukey’s post hoc testpost hoc, *P < 0.05, ***P < 0.001, compared with histones; ##P < 0.01, ###P < 0.001, compared with Nucleosomes-AAV-Veh; n = 3). (C) Representative flow cytometry images showing CD11b+CD45Low microglial ROS on 3 days after ACSF or nucleosomes stereotactic injection in mPFC with Clec2d knocking-down were presented. (D) Representative flow cytometry images and statistical analysis showing the percentage of CD11b+CD45LowMHC-II+ microglia on 3 days after ACSF or nucleosomes stereotactic injection in mPFC with Clec2d knocking-down were presented (two-way ANOVA with Tukey’s post hoc testpost hoc, ***P < 0.001, compared with ACSF; ###P < 0.001, compared with AAV-Clec2d; n = 6). (E) Concentration of IL-1β on 3 days after ACSF or nucleosomes stereotactic injection in mPFC with Clec2d knocking-down was analyzed (two-way ANOVA with Tukey’s post hoc testpost hoc, ***P < 0.001, compared with ACSF; ###P < 0.001, compared with AAV-Clec2d; n = 6). (F) Representative flow cytometry images showing CD11b+CD45Low microglial ROS on 3 days after ACSF, APC pretreatment, DNase I pretreatment, or nucleosomes stereotactic injection in mPFC were presented. (G) Representative flow cytometry images and statistical analysis showing the percentage of CD11b+CD45LowMHC-II+ microglia on 3 days after ACSF, APC pretreatment, DNase I pretreatment, or nucleosomes stereotactic injection in mPFC were presented (two-way ANOVA with Tukey’s post hoc testpost hoc, ***P < 0.001, compared with ACSF; $$$P < 0.001, compared with APC; $$$P < 0.001, compared with DNase I; n = 6). (H) Concentration of IL-1βon 3 days after ACSF, APC pretreatment, DNase I pretreatment, or nucleosomes stereotactic injection in mPFC was analyzed (two-way ANOVA with Tukey’s post hoc testpost hoc, ***P < 0.001, compared with ACSF; $$$P < 0.001, compared with APC; $$$P < 0.001, compared with DNase I; n = 6).

