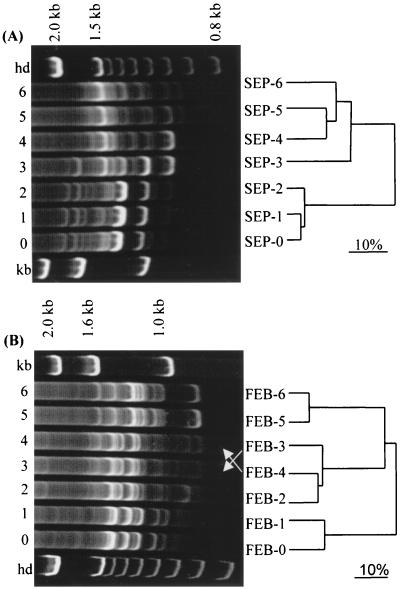
FIG. 3.
Comparison by RIS-LP analysis of different communities sampled in September 1998 (A) and February 1999 (B). The gels show the RIS-LP banding patterns; the UPGMA dendrograms show clustering analysis based on percent similarities of the communities. hd, 100-bp DNA molecular marker; kb, 1-kb DNA molecular marker. The scale bar represents 10% community dissimilarity.

