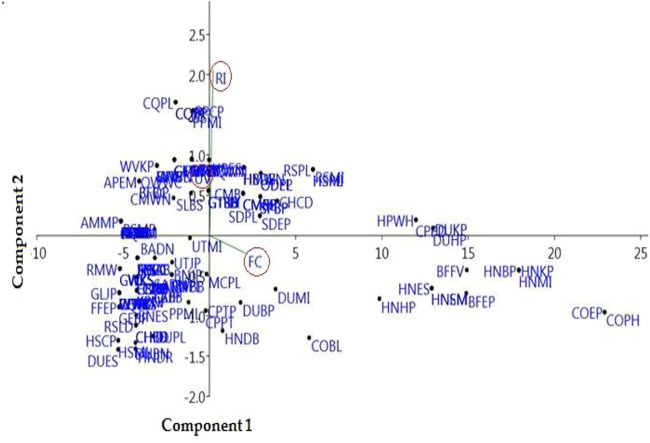
FIGURE 9.
Principal component analysis (PCA) (codes are present in Supplementary Table S1), showing the positions of the arrows relative to components 1 and 2, shows how strongly independent variables (UV, FC, and RI) are correlated with each other from the district Haveli.

