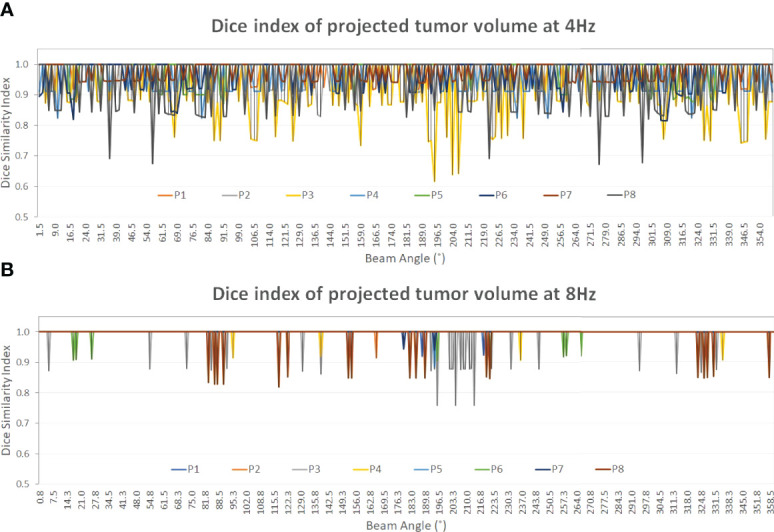
Figure 5.

The Dice similarity index of the projected tumor contours on the 2D BEV cine images between the predicted and the ground truth of the tumor volume as a function of beam angle (0°–360°). A constant gantry rotation is assumed for the two plots (Dice value display: 0.4–1.0). At both frequencies, the Dice index of patient 3 (yellow) shows the most variations among the eight patients. From 4 Hz (A) to 8 Hz (B) the average Dice index increases from 0.97 ± 0.02 to 1.00 ± 0.00 ( Table 3 ) as the prediction accuracy increases, as shown in Tables 1 , 2 .
