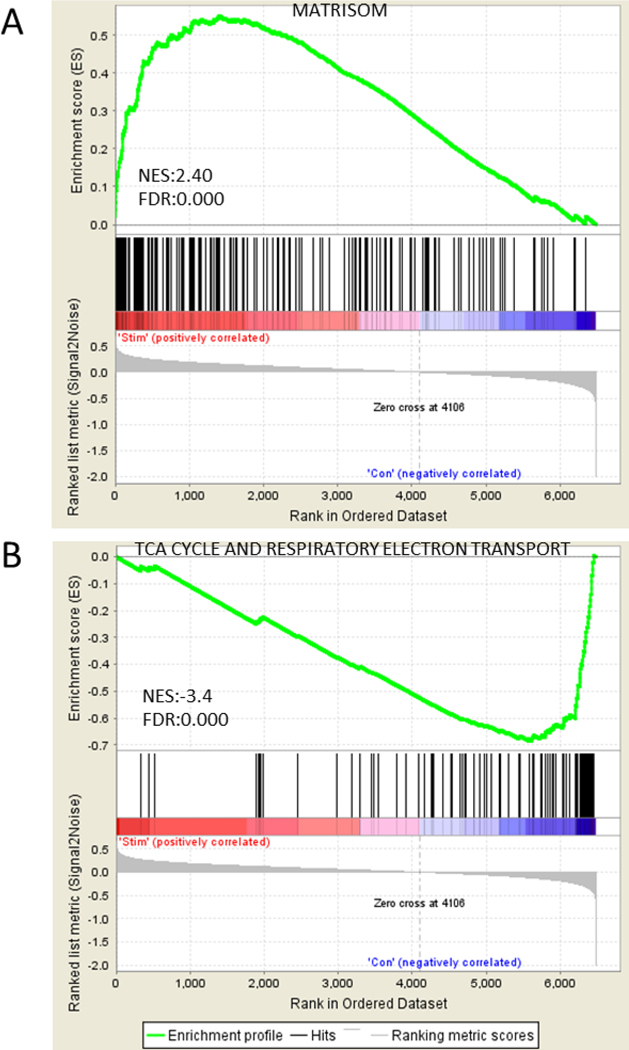
Figure 2.
The representative enrichment plots for the gene sets of both stimulated and control groups by GSEA. (A) Matrisom gene set was significantly enriched positively in the stimulated group. (B) TCA cycle and respiratory electron transport gene set was significantly enriched negatively in the control group. Top of enrichment plot, the running enrichment score for the gene set as the analysis walks down the ranked list. Middle of enrichment plot, the location of genes from the each gene set within the ranked list. Bottom of enrichment plot, plot of the ranked list of 6483 genes. Y axis, value of the ranking metric; X axis, the rank for 6483 genes. NES, Normalized enrichment score. FDR, false discovery rate.

