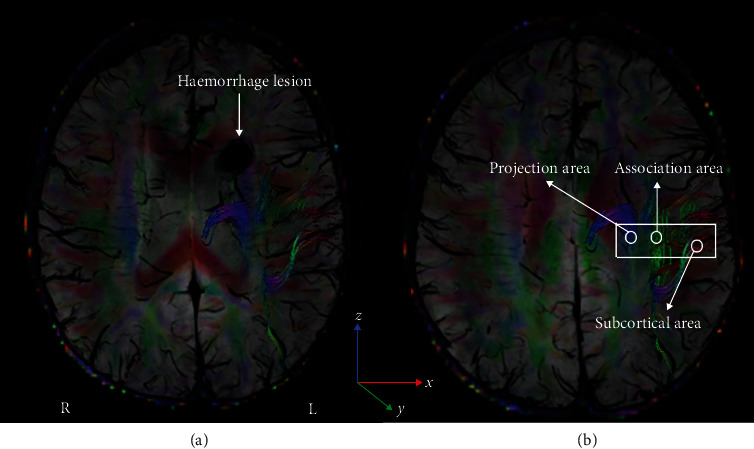
Figure 1.

The DTI and SWI fusion colour map shows the directions of the projection fibres (blue; z-axis), association fibres (green; y-axis), and subcortical fibres (red; x-axis). (a) The haemorrhage lesion located near the left lateral ventricle. (b) The ROIs placed to measure DTI parameters of the projection and association fibres. DTI: diffusion tensor imaging; SWI: susceptibility-weighted imaging.
