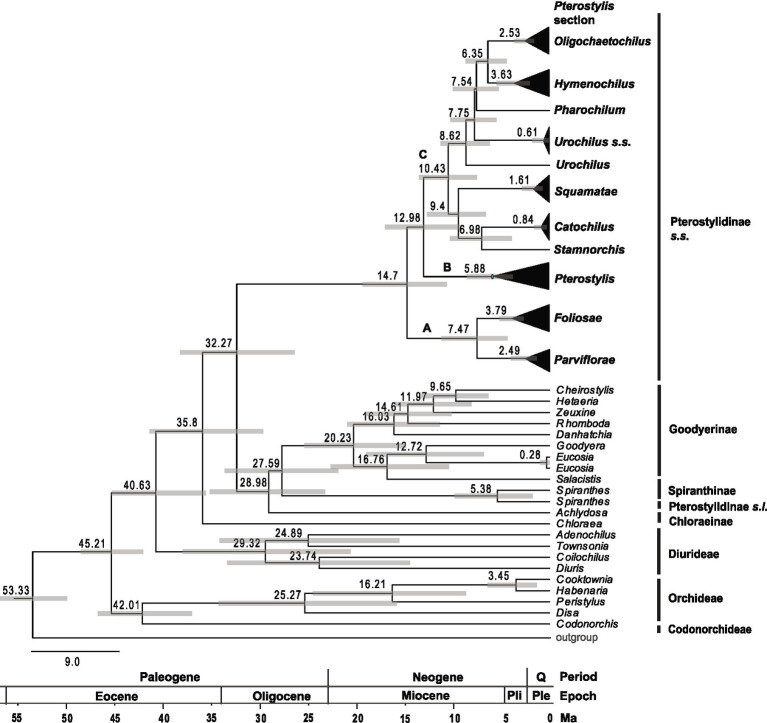
Figure 5.
Chronogram showing divergence times of main lineages within Pterostylidinae s.s. and of tribes in Orchidoideae. Maximum-clade credibility tree from Bayesian divergence-time estimation based on 25 most informative plastid genes and an uncorrelated molecular clock model under the birth–death tree prior. Divergence times (Ma) are given at each node together with 95% highest posterior density (HDP) values indicated by grey bars. The full chronogram is provided in Supplementary Material S3.

