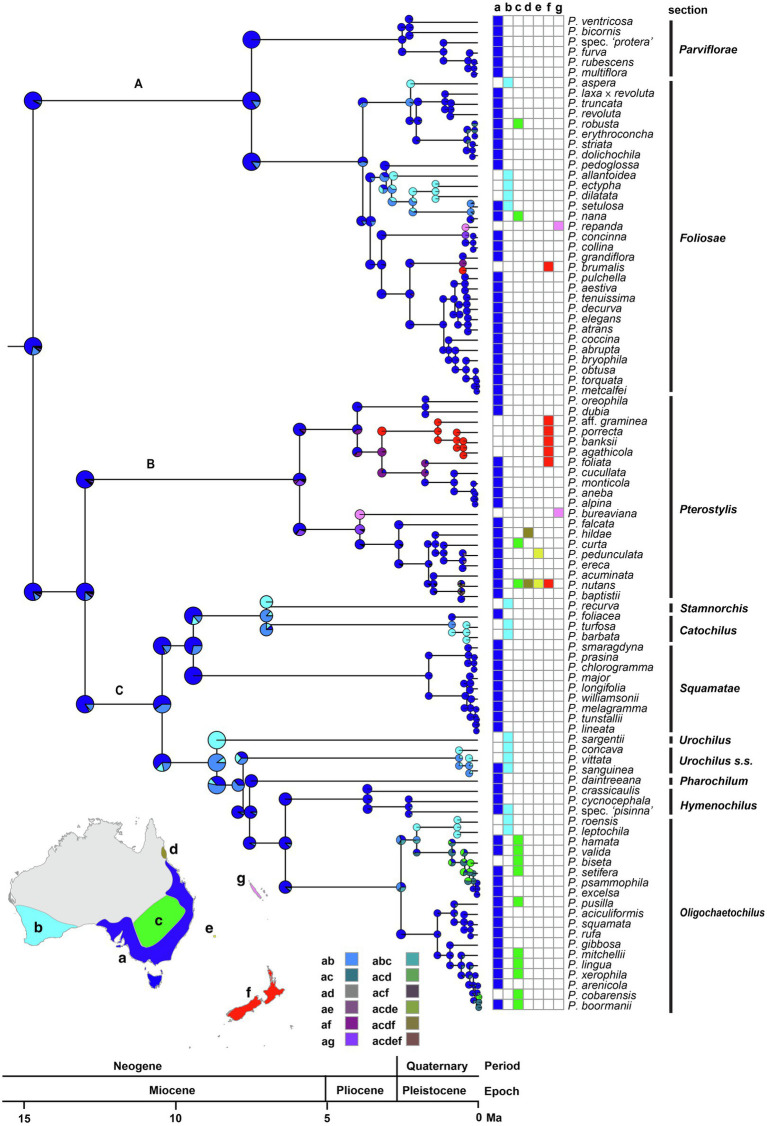
Figure 6.
Ancestral-range estimation in Pterostylidinae s.s. Maximum likelihood estimation was carried out under the dispersal-extinction cladogenesis (DEC) model and used the maximum-clade credibility tree from divergence dating analysis based on 25 plastid genes and an uncorrelated molecular clock model under the birth–death tree prior. Pie diagrams depict the relative probabilities of ancestral ranges. Relative probabilities of all alternative range evolutionary scenarios are provided in Supplementary Material S4.2. Map insert shows area delineation and grid depicts area coding for each species. a: Euronotian region; b: southwest Australia; c: Eremaean region; d: Northern region (subregion Atherton), e: Lord Howe Island; f: New Zealand and g: New Caledonia. The three major clades in Pterostylis are labelled above branches (as A, B and C).

