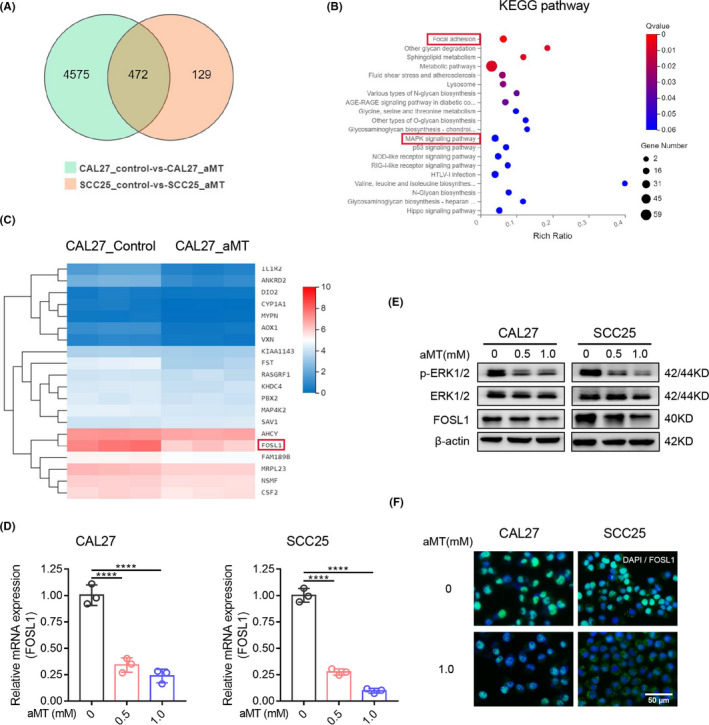
FIGURE 4.

Melatonin suppresses the phosphorylation of ERK1/2 and decreases FOSL1 expression. (A) Venn diagram of differentially expressed genes (DEGs) from RNA‐seq of CAL27 and SCC25 cells treated with or without melatonin (1 mM) for 24 h. (B) KEGG pathway enrichment analysis of DEGs. The top 20 overrepresented pathways were provided. (C) Heat map of expression clustering of the top 20 DEGs identified in CAL27 cells treated with melatonin (1 mM) for 24 h. (D) Verification of FOSL1 expression by RT‐qPCR in CAL27 and SCC25 cells treated with the indicated concentration of melatonin for 24 h. GAPDH was used as the control. One‐way ANOVA. ****, p < 0.0001. (E) Western blot analysis of ERK1/2, p‐ERK1/2, and FOSL1 in CAL27 and SCC25 cells treated with the indicated concentration of melatonin for 48 h. β‐Actin was used as the loading control. (F) Cell immunofluorescence analysis of FOSL1 in CAL27 and SCC25 cells treated with or without melatonin (1 mM) for 48 h. Scale bar, 50 μm. Independent experiments were performed in triplicate. Values are represented as means ± SD
