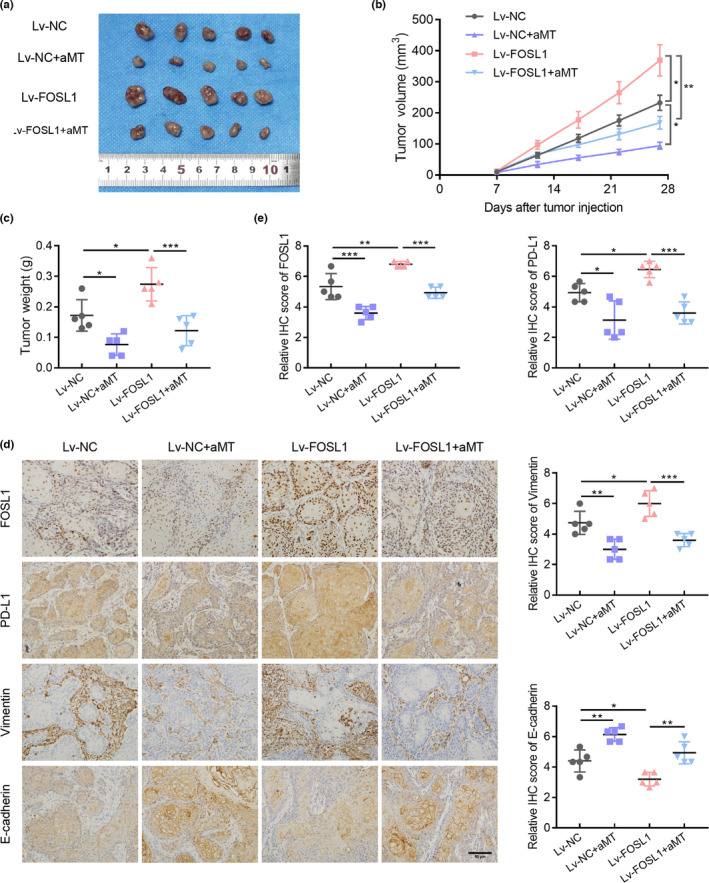
FIGURE 6.

FOSL1 mediates the effects of melatonin on EMT and PD‐L1 expression of HNSCC in vivo. (A) Images of xenograft tumors excised from nude mice. (B) Growth curves of tumors. Tumor volumes were measured every 4 days. n = 5. (C) Weights of tumors excised from the nude mice were measured and analyzed using one‐way ANOVA. (D) Representative immunohistochemistry staining of FOSL1, PD‐L1, vimentin, and E‐cadherin in tumor tissues. Scale bar, 50 μm. (E) Quantification analysis of FOSL1, PD‐L1, vimentin, and E‐cadherin staining. n = 5, one‐way ANOVA. Values are represented as means ± SD, *, p < 0.05; **, p < 0.01; ***, p < 0.001
