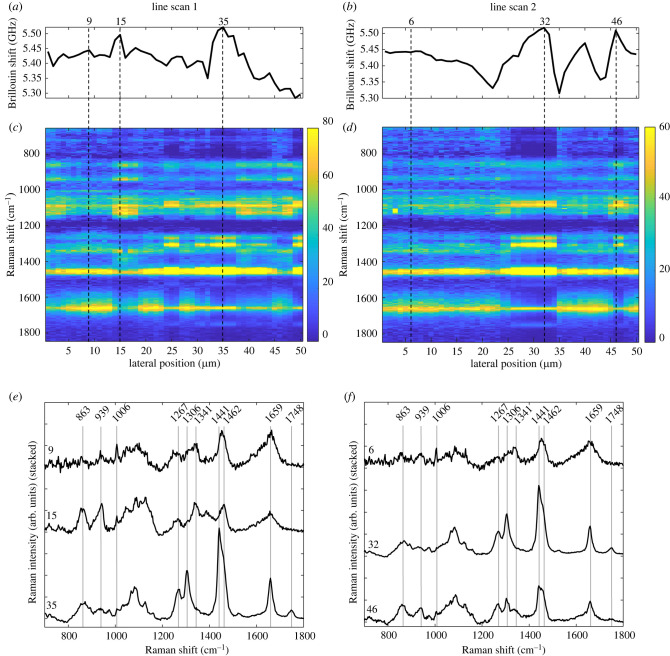
Figure 5.
Results of combined line scans on living U87-MG spheroids. Brillouin shift profiles (a,b) show regions with high frequencies which can be correlated with spectral patterns visible in the Raman heat maps (c,d), in which the area-normalized Raman intensity is colour-coded. Single Raman spectra at specific positions can be attributed to cytoplasm, lipids and protein-rich structures (e,f). Note that the Raman spectrum at 46 µm in line scan 2 actually shows a linear combination of lipid and protein bands indicating the presence of both within the measuring volume.

