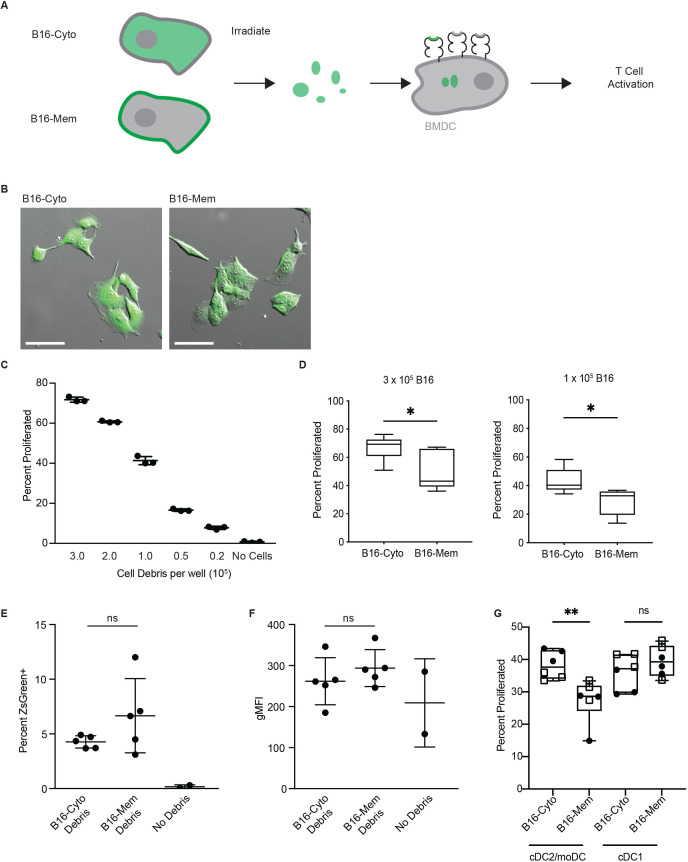
Figure 3.
Subcellular location of source proteins determines the capacity of dendritic cells to activate antigen-specific T cells. (A) Schematic of cross-priming assay using the model antigen SIINFEKL targeted to the cytoplasm or the cell membrane. (B) Differential interference contrast and epifluorescence images of B16-ZsGreen-SIINFEKL (B16-cyto) and B16-palm-ZsGreen-SIINFEKL (B16-mem) cell lines. Scale bars, 100 µm. (C) Proliferation of OT-I T cells following coculture with BM-DC pulsed for 18 hours with the indicated number of irradiated B16-cyto cells. Shown is one representative experiment of three independent repeats. (D) Proliferation of OT-I T cells following coculture with BM-DC pulsed for 18 hours with the indicated number of irradiated B16-cyto or B16-mem cells. Shown are pooled results from three independent experiments; box and whiskers indicate 95th percentile. Significance was assessed using Mann-Whitney U, *p<0.05. (E) Percent BM-DC positive for ZsGreen following 18 hours’ incubation with irradiated B16-cyto or B16-mem cells relative to a negative control. (F) gMFI of irradiated B16 cells alone and of BM-DC following 18 hours’ incubation with apoptotic B16 cells. (E, F) Shown are pooled results of three independent experiments as mean and SEM significance was assessed using MWU. (G) Proliferation of OT-I T cells following coculture with cDC2/moDC or cDC1 pulsed for 18 hours with irradiated B16-cyto or B16-mem cells at rate limiting conditions (circle 1×10⁵ and square 3×10⁵ tumor cell debris). Shown are pooled results from two independent experiments. Box and whiskers indicate min and max values. significance was assessed using MWU, **p<0.01. BM-DC, bone marrow-derived dendritic cell; gMFI, geometric mean fluorescence intensity; ns, not significant.

