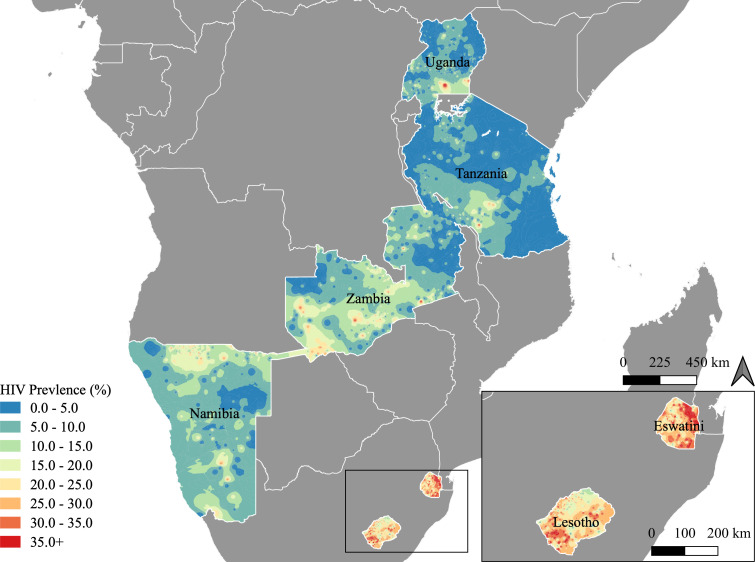
Figure 1.
Weighted map of HIV Prevalence in adults aged 15-59. Maps were generated with SAGA in QGIS V.3.4. We used georeferenced weighted averages at the enumeration area (EA) level, with all cases linked to the centroid of the EA, and kernel density smoothing and interpolation over 200 adult participants for each smoothing circle.

