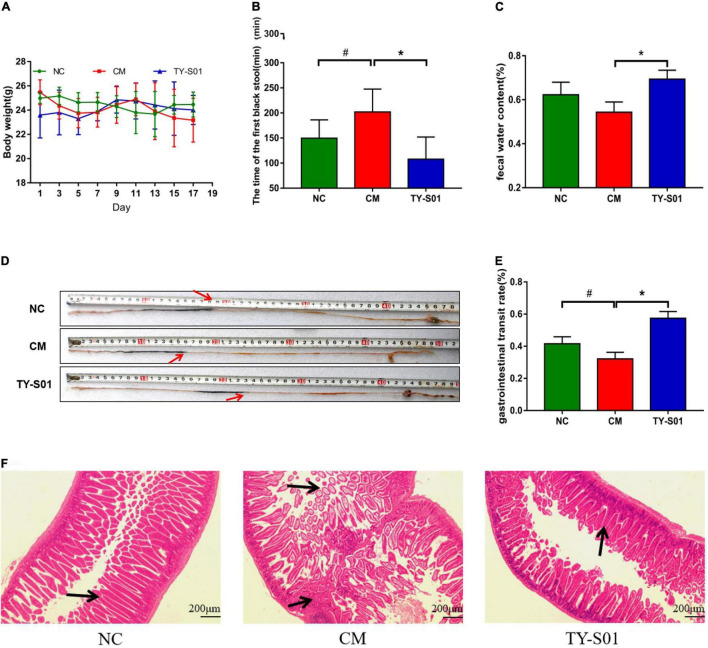
FIGURE 1.
TY-S01 prevented loperamide-induced constipation in mice. (A) Body weight; (B) the time of the first black stool; (C) fecal water content; (D) intestinal advancement distance; (E) gastrointestinal transit rate; and (F) small intestinal sections stained with hematoxylin and eosin. NC is the normal control group; CM is the constipation model group; TY-S01 is the treatment group with TY-S01. # represents the significant difference between the NC and CM groups (p < 0.05); * represents the significant difference between the CM and TY-S01 groups (p < 0.05). Data are presented as mean ± SD.

