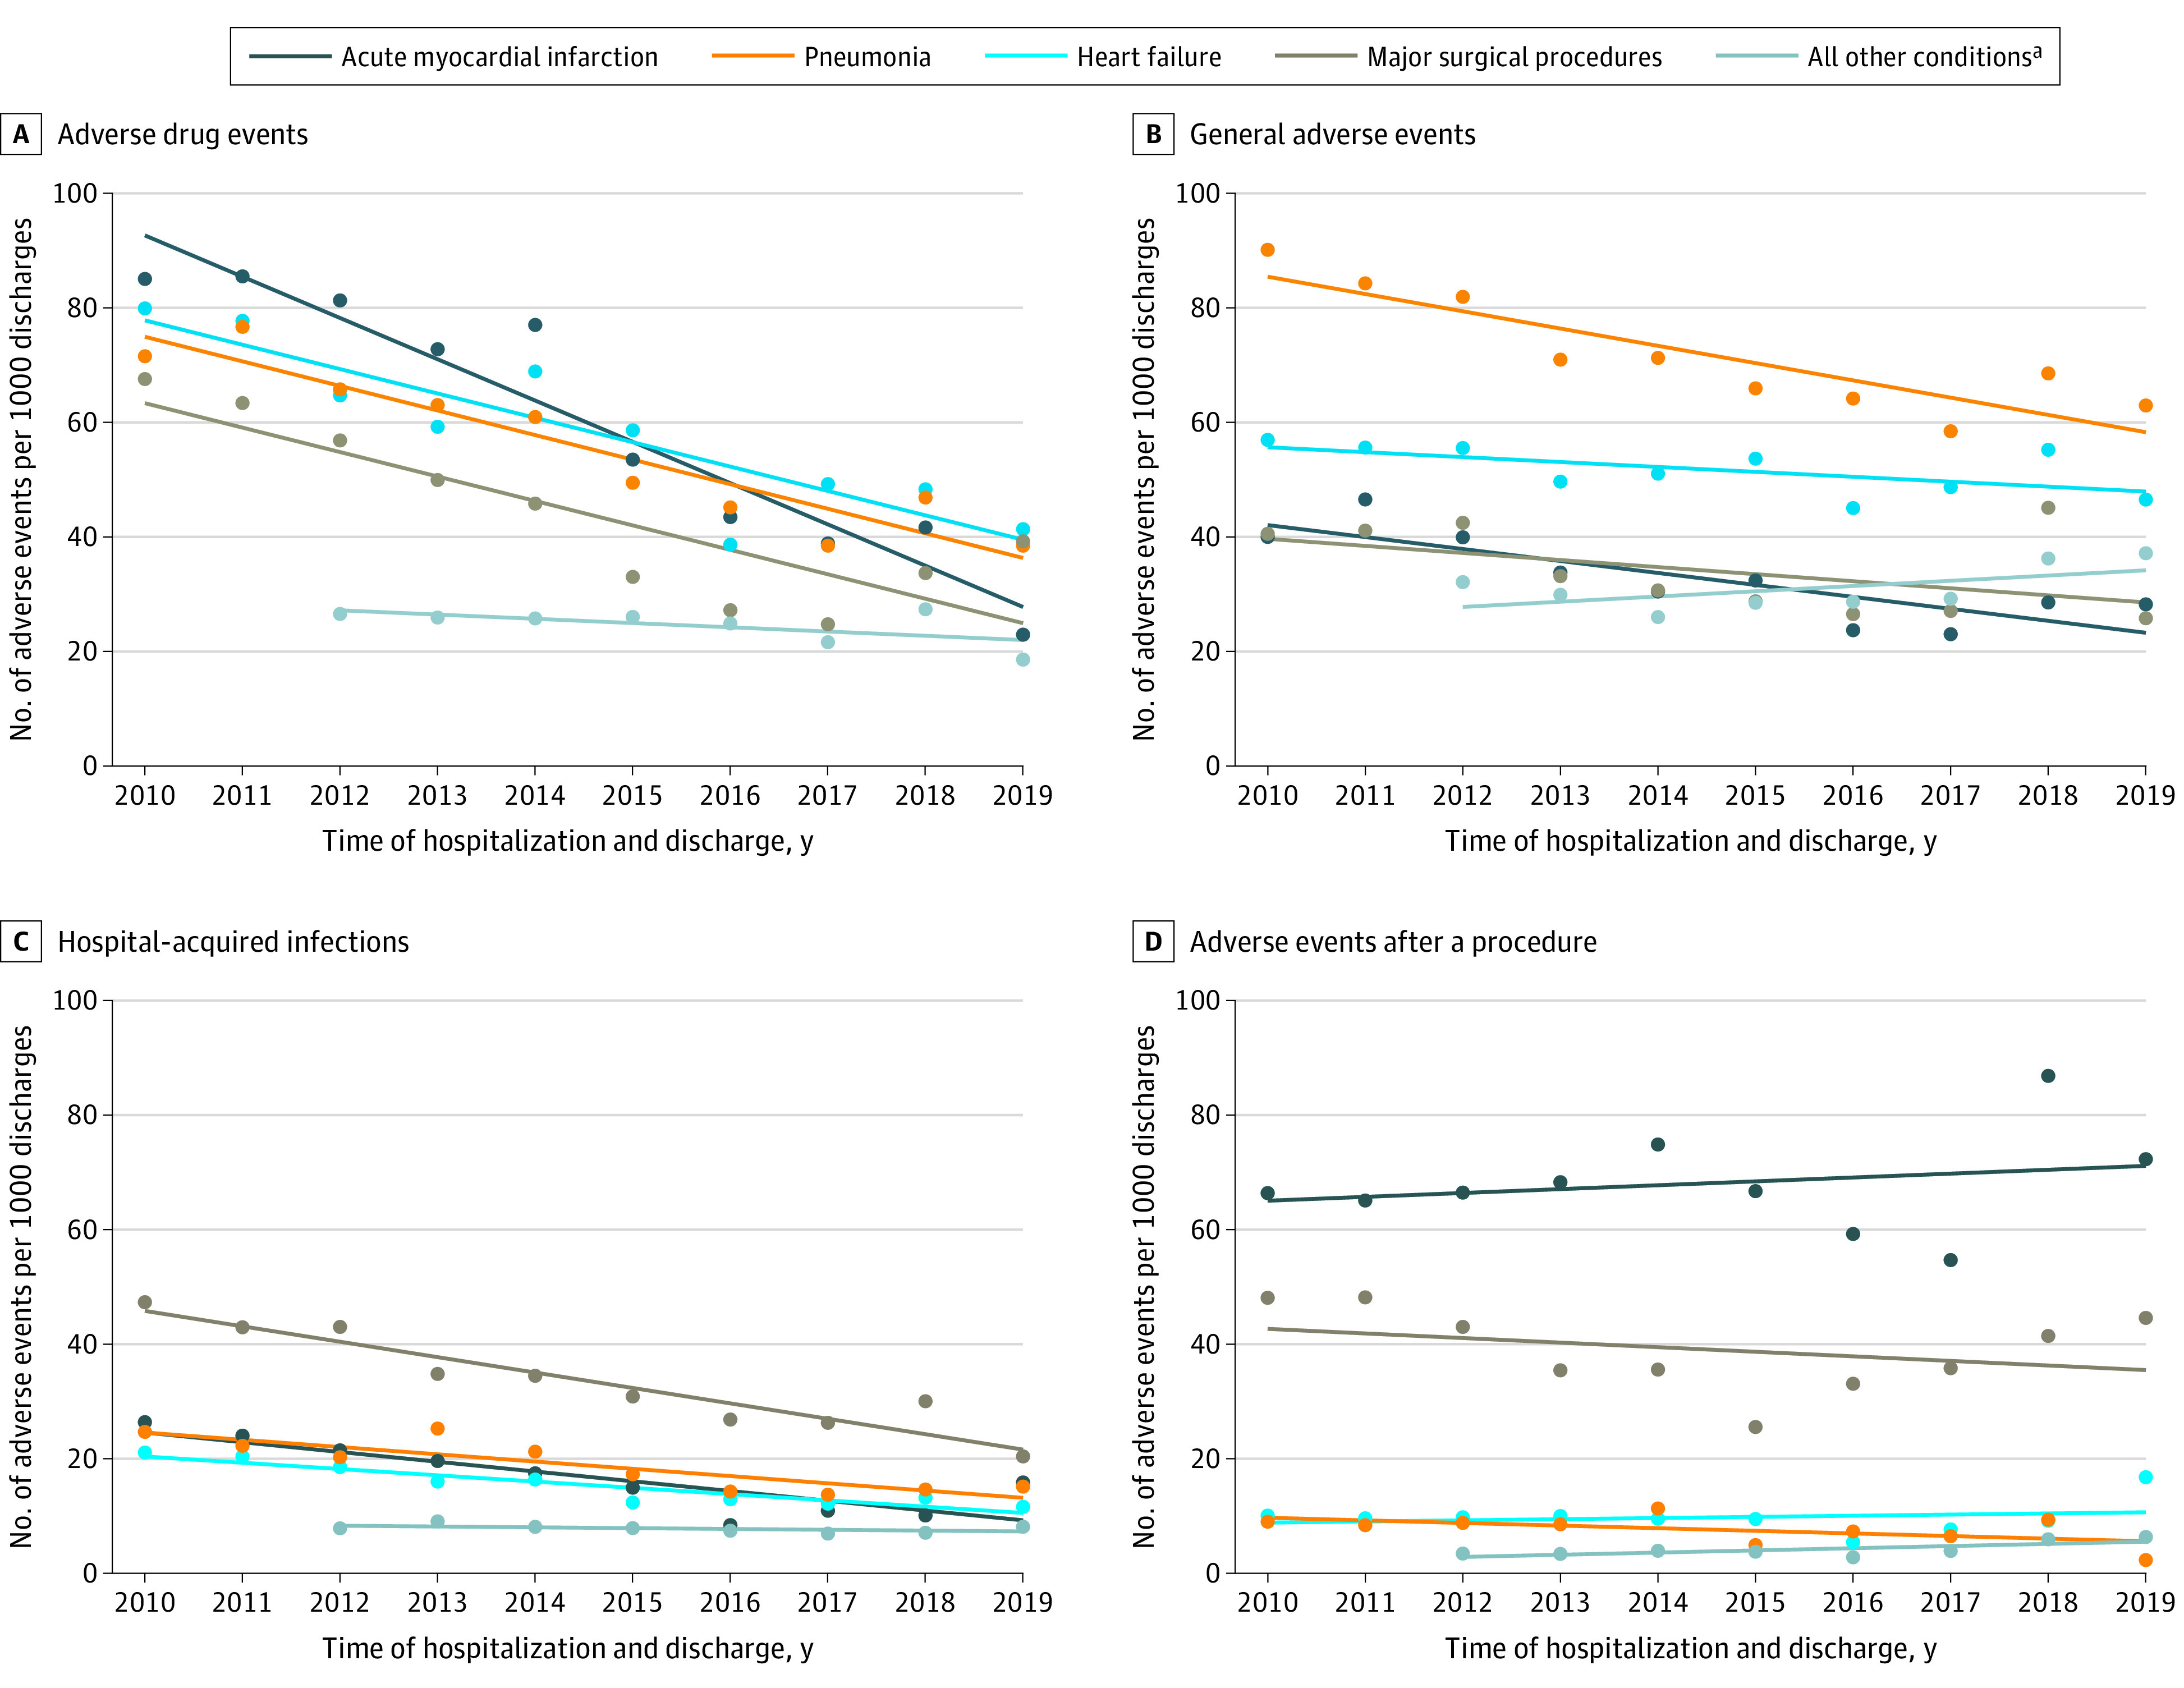
Figure 1. Observed Adverse Event Rates by the 4 Medicare Patient Safety Monitoring System Adverse Event Domains.

The circles denote the observed values and the lines represent the trends over time. Additional information appears in eTable 15 in the Supplement.
aData were not available for 2010 and 2011.
