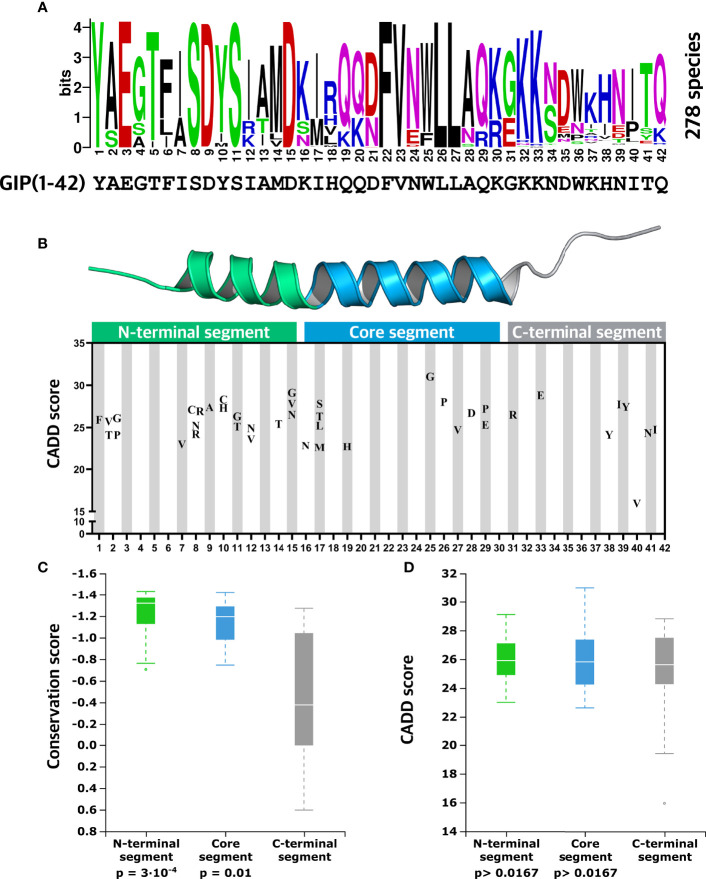
Figure 4.
Evolutionary insights into essential GIP peptide positions. (A) Amino acid conservation logo plot determined by multiple sequence alignment using GIP sequences from 278 different species. The overall height over the letter stack indicates sequence conservation in the specific position, whereas the height of each letter indicates the relative frequency of each amino acid at that specific position. (B) Distribution of missense variants in the GIP peptide is displayed along with predicted deleteriousness using the CADD (Combined Annotation-Dependent Depletion) score. (C) Comparisons of mean conservation score between the GIP peptide segments show that the N-terminal segment (positions 1-15) and core segment (positions 16-30) display a significantly higher degree of conservation compared to the C-terminal segment. (D) Aggregated mean CADD scores (abbreviation of Combined Annotation-Dependent Depletion, predicting variant deleteriousness) for individual GIP peptide segments show that variants in the GIP sequence exhibit similar mean CADD score independent of the segment they are located in. Statistical significance between sample means was assessed using the Mann-Whitney U test (p-value threshold 0.0167).

