Figure 1.
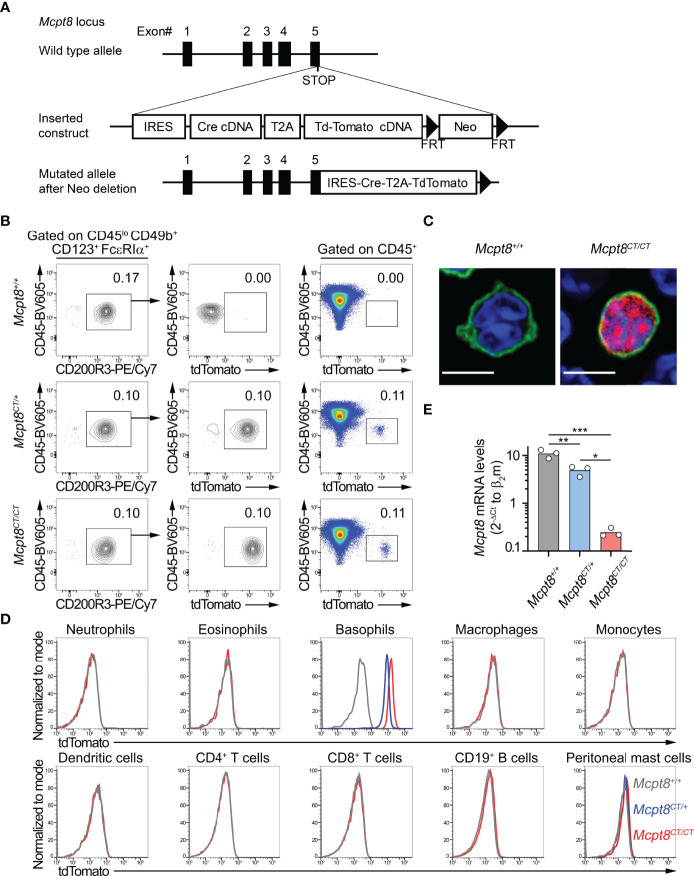
The CT-M8 mice: a new basophil-specific mouse model. (A) Schematic representation of Mcpt8-Cre-tdT knock-in targeting constructs to generate the CT-M8 (Mcpt8tm1Ics ) mice (see Methods) where Cre and tandem tomato fluorescent protein are expressed under the control of the basophil-specific Mcpt8 promoter. (B) Fluorescence-activated cell sorter (FACS) gating strategy showing tdTomato expression in spleen basophils from Mcpt8CT/CT and Mcpt8CT/+ mice but not in wild-type animals (Mcpt8+/+ ). (C) Basophil-specific tdTomato expression (red) imaged by confocal microscopy on splenocytes from Mcpt8+/+ (left) and Mcpt8CT/CT (right) mice, stained with anti-IgE antibody (green) and DNA staining (DAPI, blue). Scale bar, 5 µm. Larger fields are shown in Supplementary Figure S1 . (D) Expression of the tdTomato assessed by flow cytometry in the indicated spleen cell types (except for peritoneal mast cells, which are from the peritoneal cavity) defined as described in Table 1 in Mcpt8+/+ (grey lines), Mcpt8CT/+ (blue lines), and Mcpt8CT/CT (red lines). One representative set of data out of 4 per genotype is shown. (E) Mcpt8 mRNA expression levels were assessed by RT-quantitative PCR on mRNA purified from FACS-sorted bone marrow primary basophils from mice of the indicated genotypes (see Methods). Data are expressed as the mean of the 2−ΔCt values of Mcpt8 relative to the β2-microglobulin Ct. Individual values are shown inside bars. Statistical analyses were done by one-way ANOVA followed by Tukey’s multiple comparisons test. * p < 0.05; **p < 0.01; *** p < 0.001.

