
FIGURE 4.
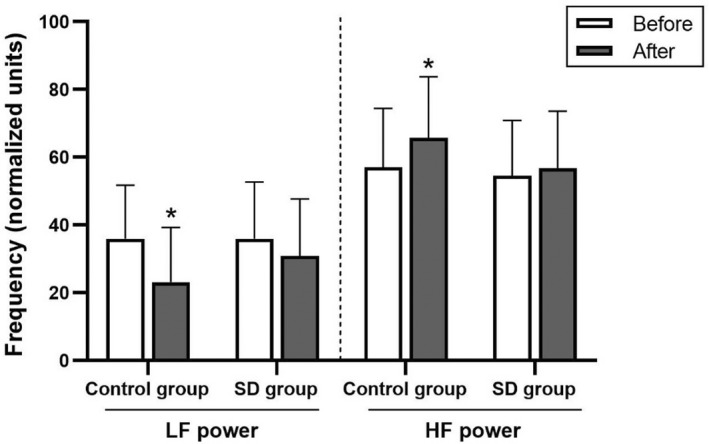
Low‐frequency (LF) and high‐frequency (HF) powers in normalized units in the control and sleep deprivation (SD) groups before and after 4‐7‐8 breathing control. Data are presented as mean ± standard deviation. *Significant difference compared with before 4‐7‐8 breathing control (p < 0.05).