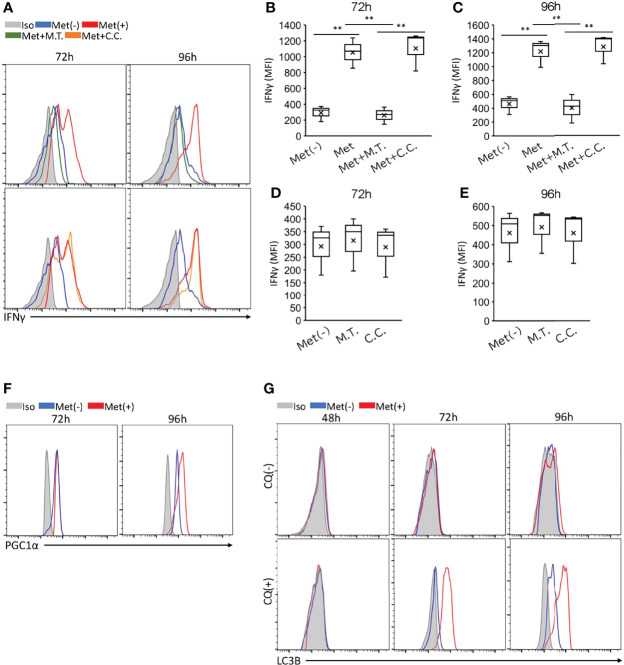
Figure 3.
Met-induced enhancement of IFNγ, PGC1α, and LC3B of CD8+ T cells and the effects of inhibitors. Splenic CD8+ T cells were cultured with anti-CD3 and anti-CD28 Abs in the presence or absence of 10 μM Met for 48, 72 or 96 h. (A–E) The resulting cells were stimulated with PMA and ionomycin in the presence or absence of Met and inhibitors as indicated for 6h. (A) A representative flow cytometry plot showing IFNγ levels in the CD8+ T cells treated with or without Mito Tempo (M.T.) (upper panels), and Compound C (C.C.) (lower panels). (B–E) The graph represents the MFI of IFNγ levels at (B, D) 72 h and (C, E) 96 h. (F) A representative flow cytometry plot showing PGC1α levels in the CD8+ T cells that were cultured for 72 or 96 h with or without Met. (G) A representative flow cytometry plot showing LC3B levels in the CD8+ T cells that were cultured for 48,72, and 96h with or without treatment by Chloroquine (CQ) for last 6h. The graphs represent Mean ± SEM of the results of three independent experiments. Statistical analysis was performed by unpaired, two-tailed Student’s t-test (**P ≤ 0.01).

