
Figure 6.
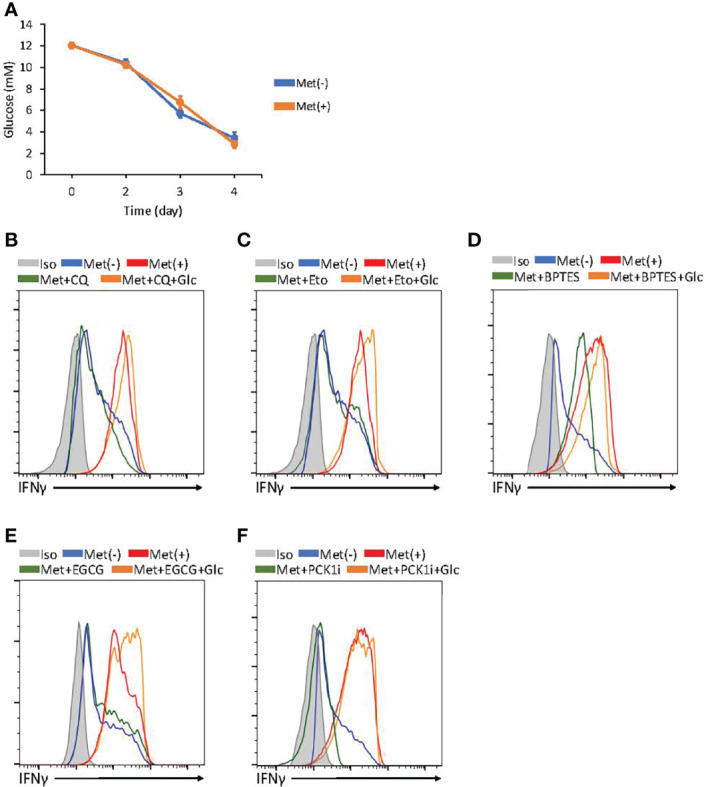
Glucose concentration determines metabolism required for IFNγ production by in vitro activated CD8+ T cells. (A) The graphs represent the glucose concentrations in the supernatant of CD8+ T cell cultured with or without Met. (B–F) In vitro activated CD8+ T cells at 72h were further incubated with or without supplementation of glucose for additional 24h and the resulting cells were treated with PMA and ionomycin in the presence or absence of inhibitors, as indicated in CQ (B), Etomoxir (C), BPTES (D), epigallocatechin gallate (EGCG) (E), and 3MPA(PCL1i) (F). A representative flow cytometry plot showing the in vitro IFNγ levels in the CD8+ T cells at 96h. The graphs represent the mean ± SEM.