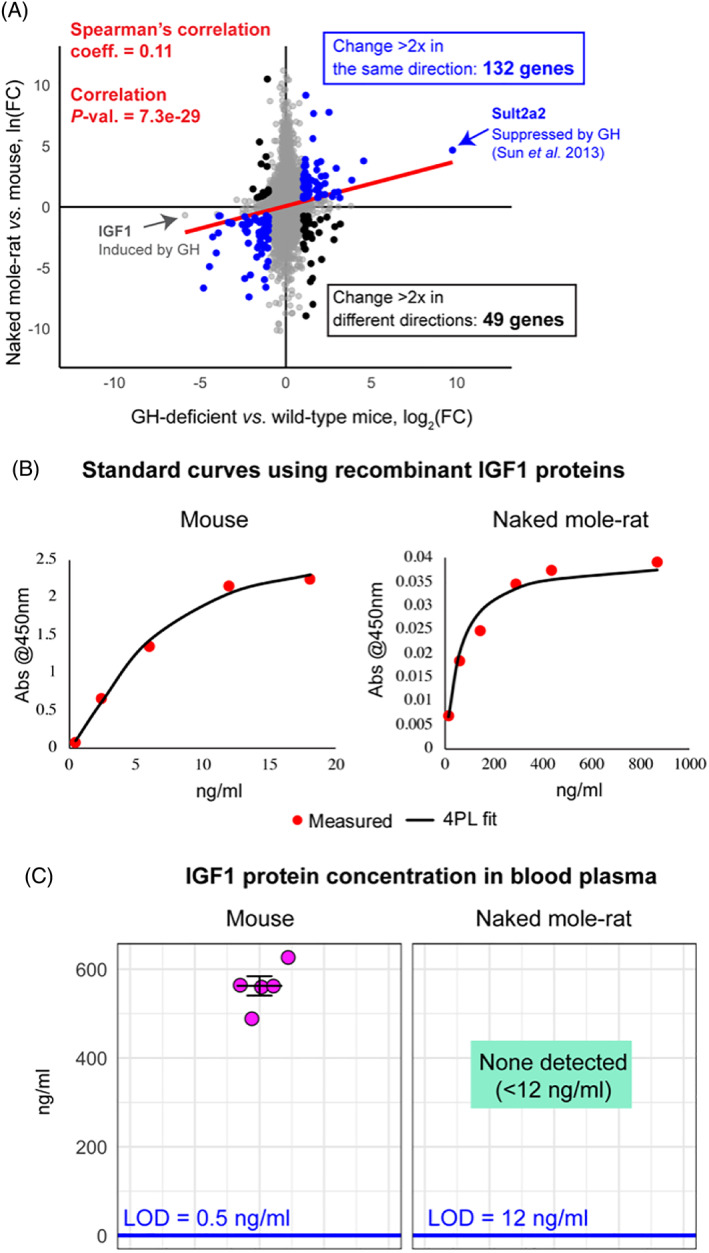
Fig 4.

(A) Liver gene‐expression profiles of growth hormone (GH)‐deficient (Ghrh −/−) mice and naked mole‐rats. Gene fold‐changes (FCs) were calculated relative to wild‐type mice for each organism, using ortholog conversion for naked mole‐rat genes (reciprocal best BLAST hits). Spearman's rank correlation coefficient for all genes on the plot and the correlation P‐value are shown in red. Of the genes that change substantially in both organisms (>twofold), those that change concordantly (blue) outnumber those that change non‐concordantly (black). Genes of special interest are labelled – insulin‐like growth factor 1 (IGF1; induced by GH) is down‐regulated in both organisms and sulfotransferase family 2A (Sult2a2) (repressed by GH) is upregulated in both organisms. Data for Ghrh −/− mice was obtained from GSE51108. Data for naked mole‐rats were generated by N. Rubinstein and R.B. and analysed by K.P. (B) Standard curves for commercial IGF1 enzyme‐linked immunosorbent assay (ELISA) (ALPCO 22‐IG1MS‐E01) generated using recombinant mouse and naked mole‐rat IGF1 proteins and four‐parameter logistic regression (4PL). (C) Concentration of IGF1 in blood plasma of young adult animals, measured using standard curves in B. Mice were 3.5 months old and naked mole‐rats were 2–2.3 years old; three females and two males were used in both groups. LOD, limit of detection.
