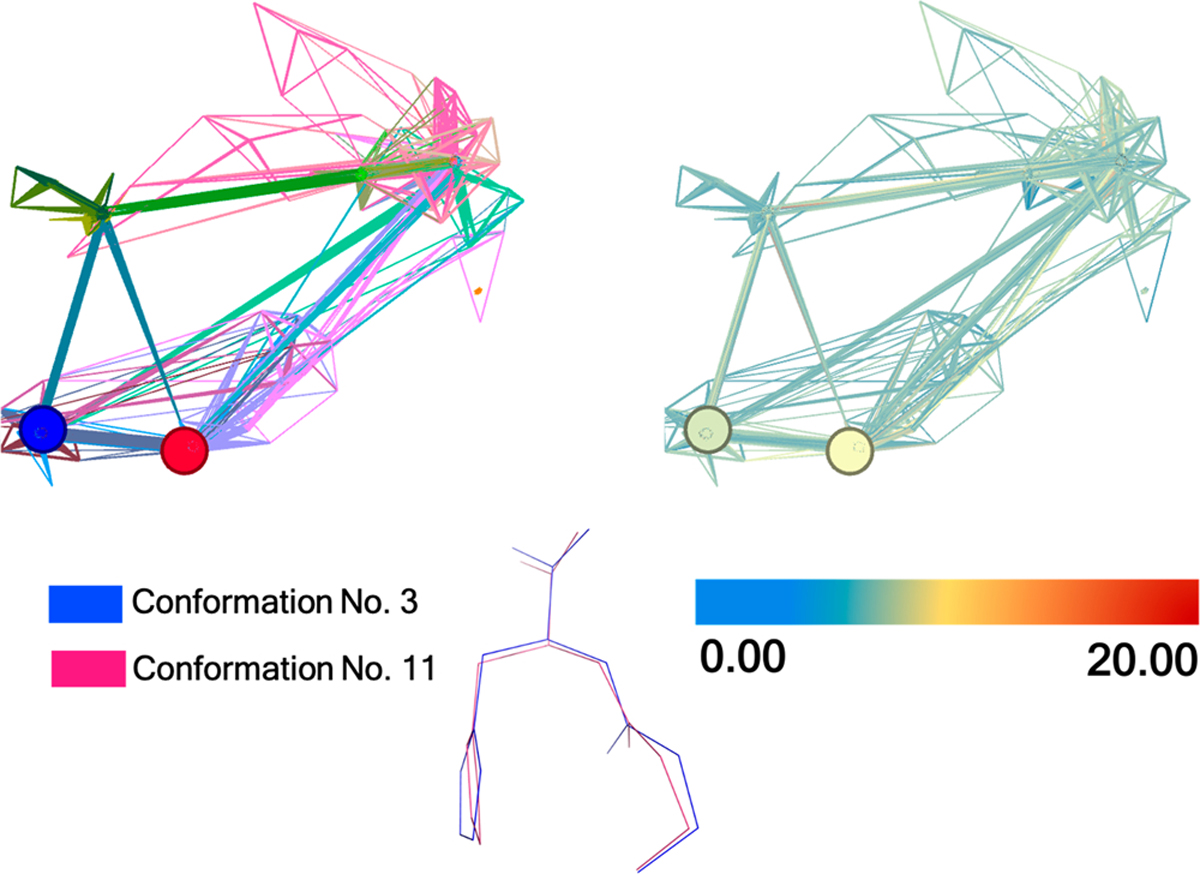
Figure 4.

Unsupervised clustering of carnosine (model 4) by AutoGraph. Twelve different colors represent the 12 cluster regions (Left). Low to high energies (ANI-1ccx potential) are represented by blue to red, respectively, and the relative energy value is in kcal mol−1 (right). Figure generated with the Gephi software.
