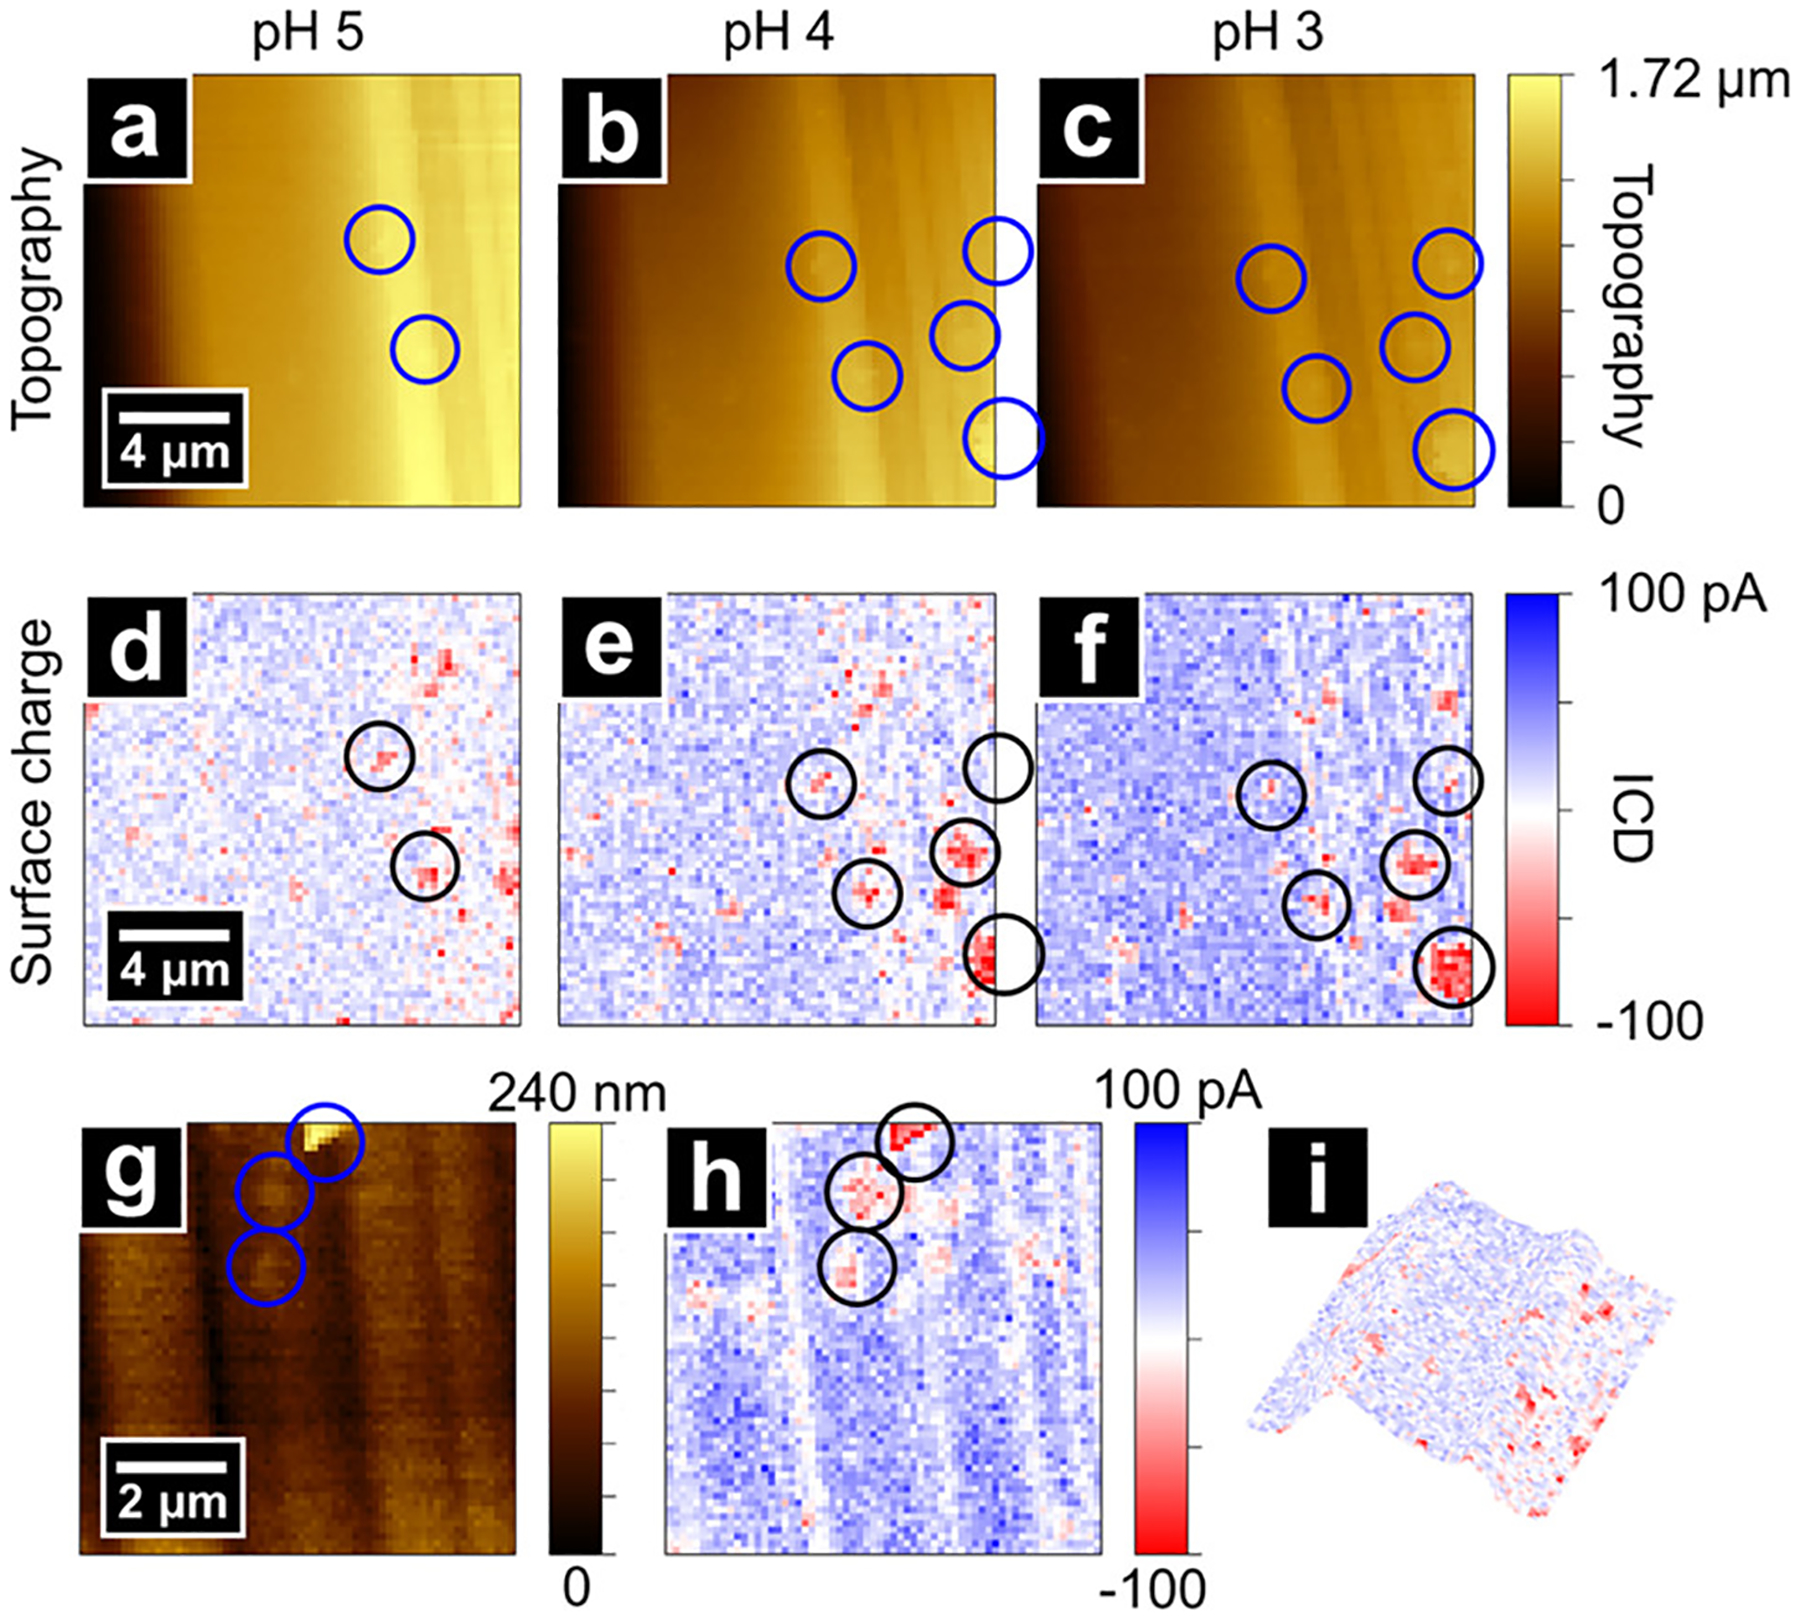
Figure 4.

Topography and surface charge images of an area on edge surfaces of a dickite crystal at pH 5 (a,d), 4 (b,e), and 3 (c,f). The scan area is dominated by positively charged edges with neutral/negatively charged regions between lamellae. In addition, several negatively charged islands are observed due to small dickite flakes adhered to the surface. The addition of acid increases the positive charge intensity at edges whereas the negative surface charge remains constant. (g,h) High-resolution images within the area of (c,f). A 3D rendering of topography and surface charge from panels (a,d) is shown in panel (i).
