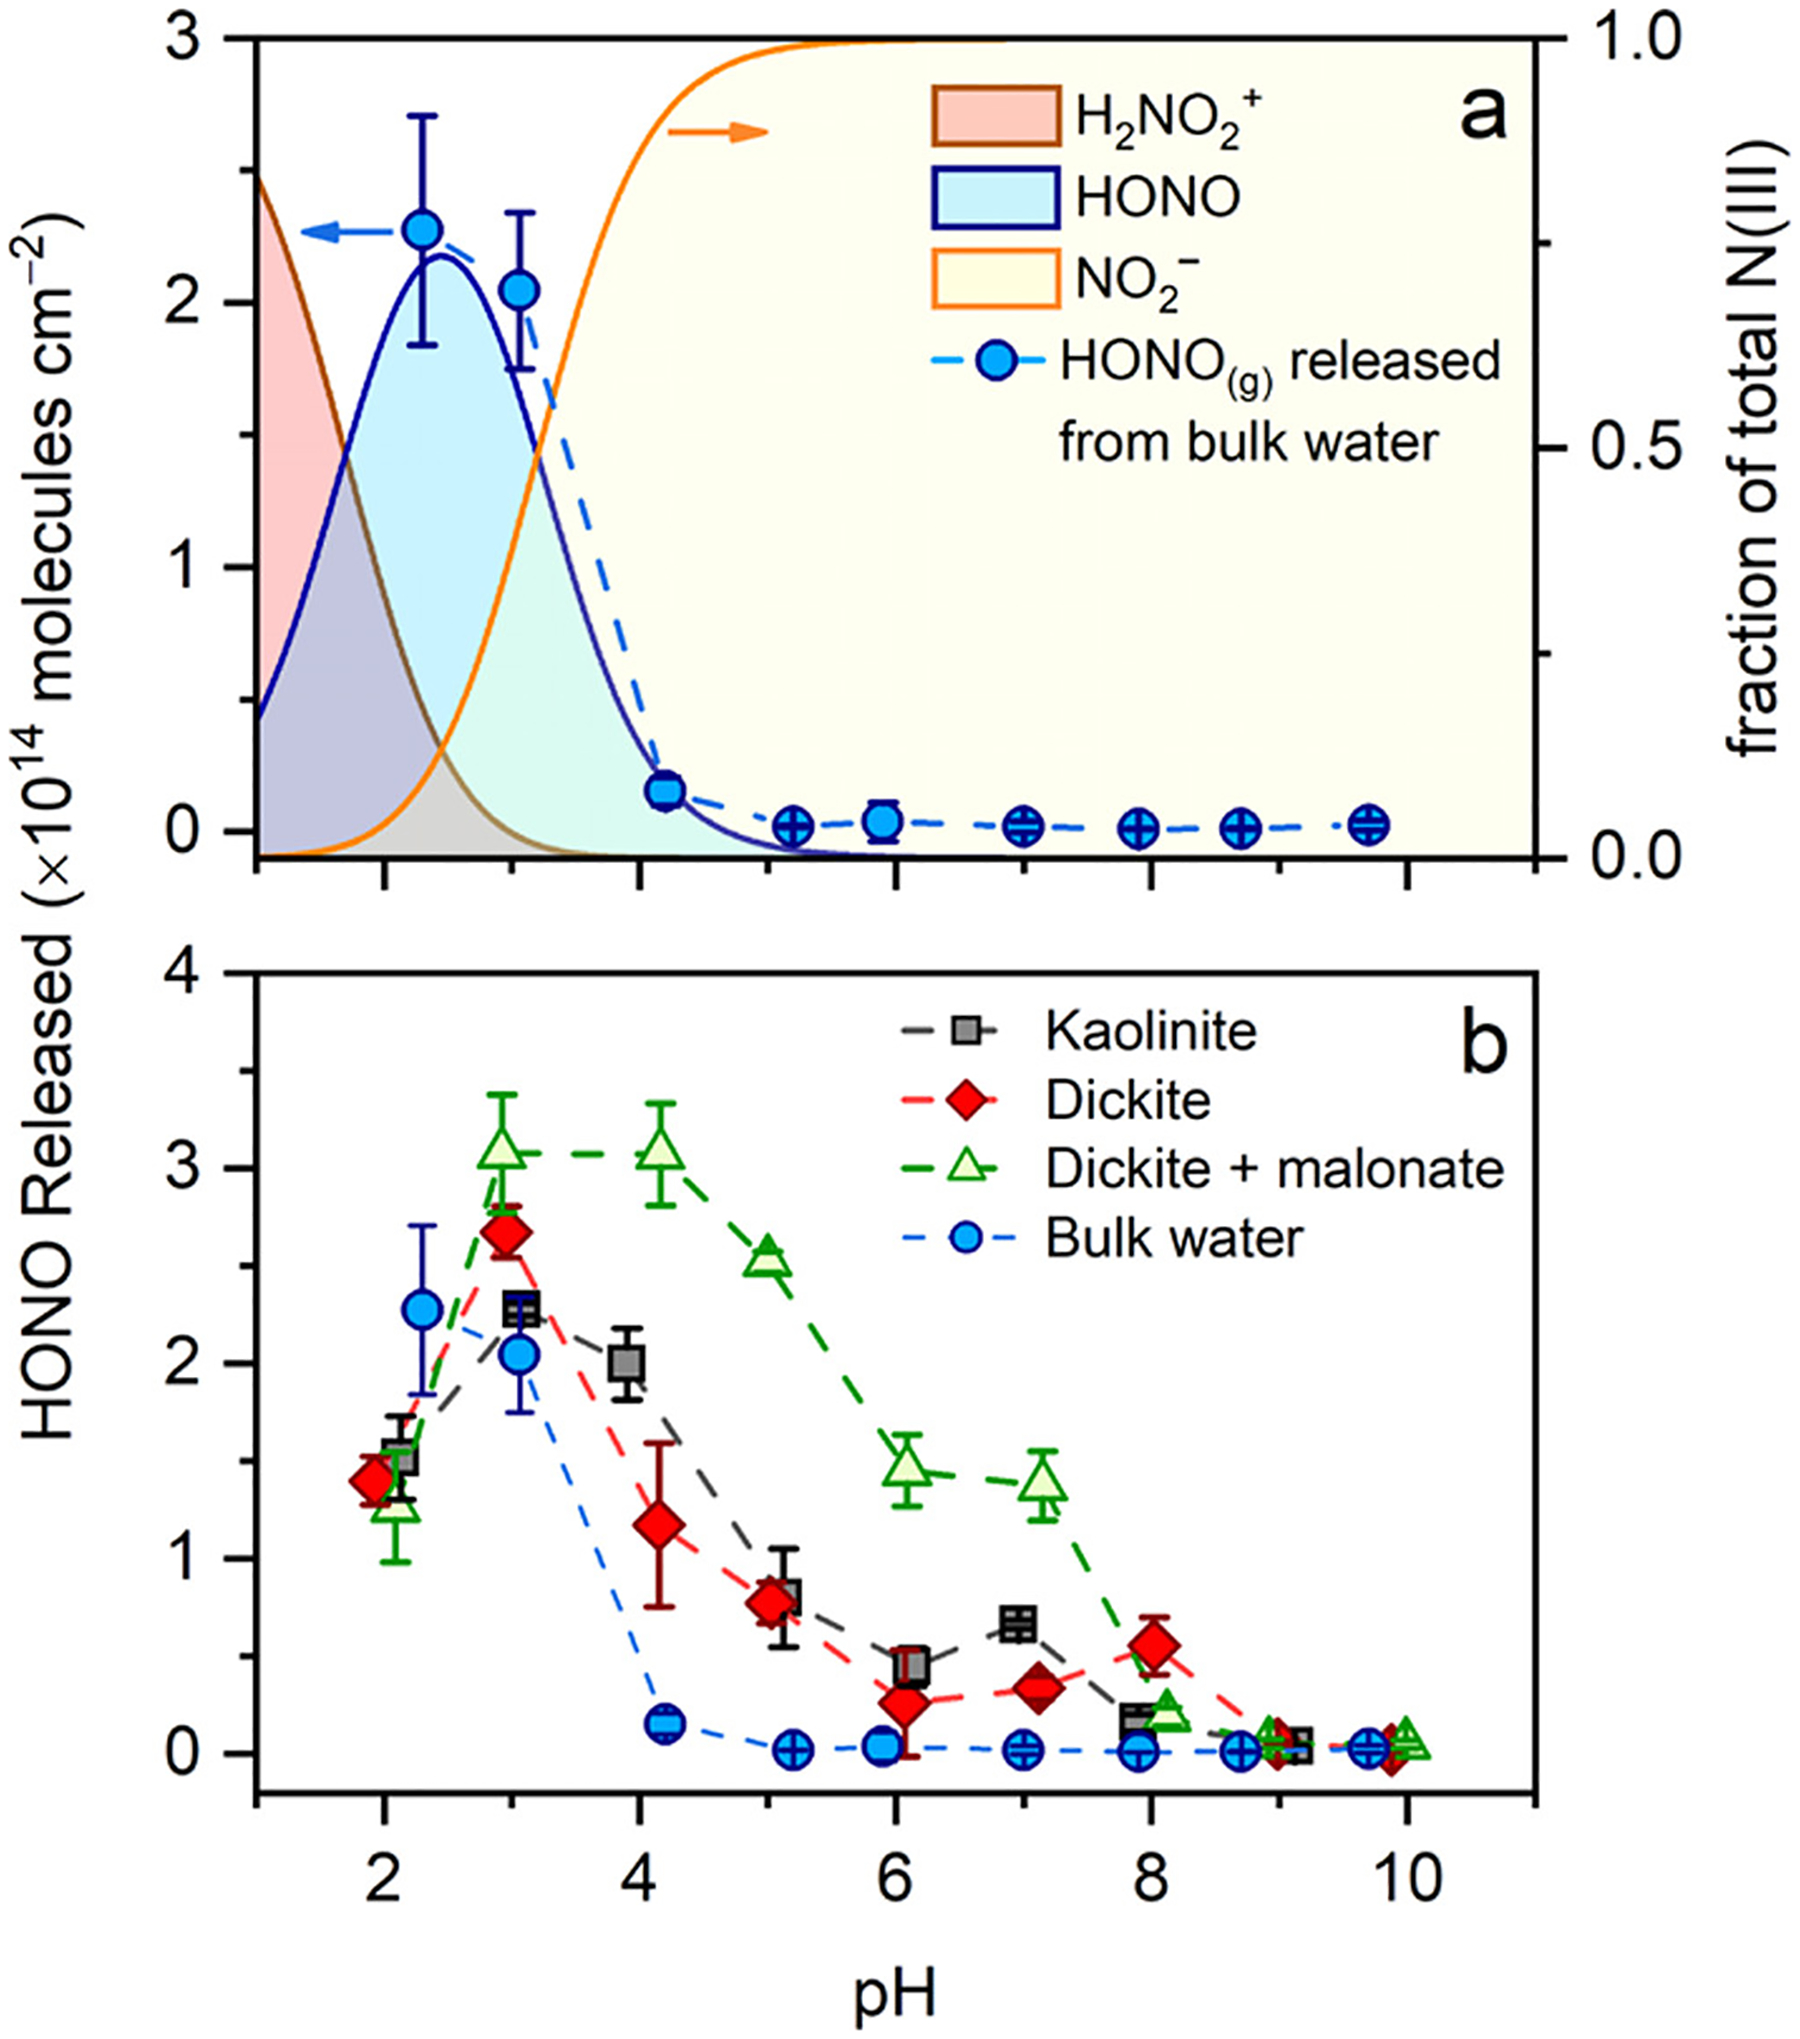
Figure 6.

Amount of HONO(g) emitted following addition of 1 nmol of nitrite to pure water (a) or clay mineral surfaces (b) that were pH-adjusted. Data are normalized to the geometric surface area of the sample. Dotted lines are guides for the eye, and the error bars represent the 95% confidence interval of the mean of three replicate measurements. The equilibrium distribution of indicated N(III) species in aqueous solution as a function of pH is included for comparison in panel (a).
