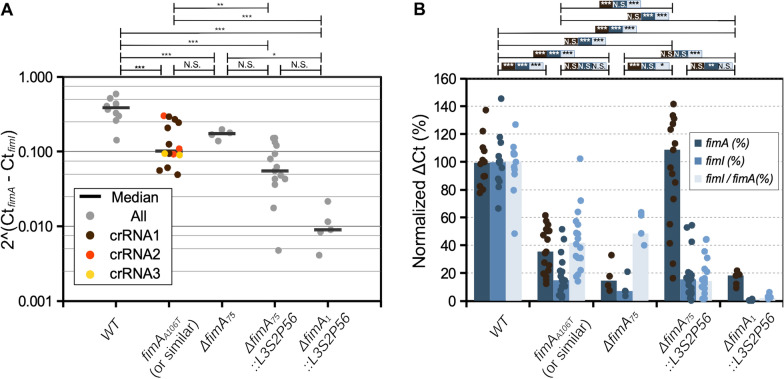
Fig. 4.
Quantitative PCR analysis of fimA and fimI expression in different E. coli derivatives. A fimI expression normalized to fimA expression. Each data point represents a biological replicate and the median is shown as a horizontal bar. B Same data used in A but represented as median ΔCt expression of fimA and fimI normalized to the housekeeping genes hcaT and cysG and expressed as percent of the wild type. The statistical analysis shows the results of a one-way ANOVA (panel A and %ΔCt fimI/fimA ratio in panel B or two-way ANOVA (%ΔCt of fimI and fimA in panel B followed by Tukey's HSD multiple comparison tests. P values: P ≤ 0.001 (***), P ≤ 0.01 (**), P ≤ 0.05 (*), P ≤ 0.1 (0.1), NS not significant

